Table of contents
- 1. Intro to Stats and Collecting Data(0)
- 2. Describing Data with Tables and Graphs(0)
- 3. Describing Data Numerically(0)
- 4. Probability(0)
- 5. Binomial Distribution & Discrete Random Variables(0)
- 6. Normal Distribution and Continuous Random Variables(0)
- 7. Sampling Distributions & Confidence Intervals: Mean(0)
- 8. Sampling Distributions & Confidence Intervals: Proportion(0)
- 9. Hypothesis Testing for One Sample(0)
- 10. Hypothesis Testing for Two Samples(0)
- 11. Correlation(0)
- 12. Regression(0)
- 13. Chi-Square Tests & Goodness of Fit(0)
- 14. ANOVA(0)
2. Describing Data with Tables and Graphs
Visualizing Qualitative vs. Quantitative Data
2. Describing Data with Tables and Graphs
Visualizing Qualitative vs. Quantitative Data: Videos & Practice Problems
14 of 0
Problem 14Multiple Choice
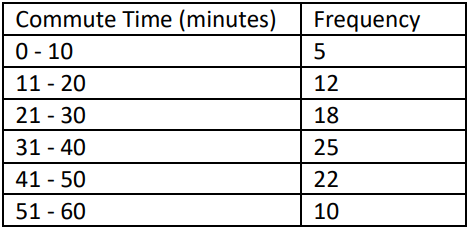
A study was conducted to analyze the commute times (in minutes) of employees in a metropolitan city. The collected data was grouped into the following frequency distribution:

Construct a frequency polygon to represent the commute time distribution.
Based on the frequency polygon, does the graph suggest that the distribution is skewed? If so, how?

0 Comments