Table of contents
- 1. Intro to Stats and Collecting Data(0)
- 2. Describing Data with Tables and Graphs(0)
- 3. Describing Data Numerically(0)
- 4. Probability(0)
- 5. Binomial Distribution & Discrete Random Variables(0)
- 6. Normal Distribution and Continuous Random Variables(0)
- 7. Sampling Distributions & Confidence Intervals: Mean(0)
- 8. Sampling Distributions & Confidence Intervals: Proportion(0)
- 9. Hypothesis Testing for One Sample(0)
- 10. Hypothesis Testing for Two Samples(0)
- 11. Correlation(0)
- 12. Regression(0)
- 13. Chi-Square Tests & Goodness of Fit(0)
- 14. ANOVA(0)
11. Correlation
Correlation Coefficient
11. Correlation
Correlation Coefficient: Videos & Practice Problems
7 of 0
Problem 7Multiple Choice
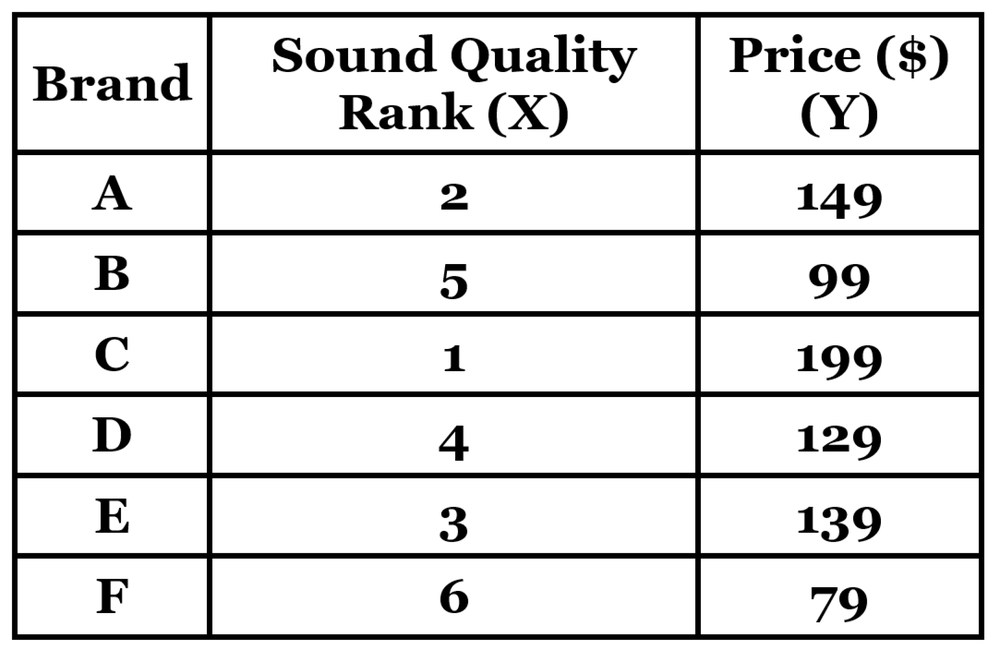
The following table lists sound quality rankings and prices (in dollars) for different brands of wireless earbuds (based on hypothetical data). Lower values of the sound quality rankings correspond to better audio performance.

Use the rank correlation coefficient to test for a correlation between the two variables. Use a significance level of . Do the more expensive brands appear to have better sound quality?
0 Comments