Table of contents
- 1. Intro to Stats and Collecting Data(0)
- 2. Describing Data with Tables and Graphs(0)
- 3. Describing Data Numerically(0)
- 4. Probability(0)
- 5. Binomial Distribution & Discrete Random Variables(0)
- 6. Normal Distribution and Continuous Random Variables(0)
- 7. Sampling Distributions & Confidence Intervals: Mean(0)
- 8. Sampling Distributions & Confidence Intervals: Proportion(0)
- 9. Hypothesis Testing for One Sample(0)
- 10. Hypothesis Testing for Two Samples(0)
- 11. Correlation(0)
- 12. Regression(0)
- 13. Chi-Square Tests & Goodness of Fit(0)
- 14. ANOVA(0)
2. Describing Data with Tables and Graphs
Frequency Distributions
2. Describing Data with Tables and Graphs
Frequency Distributions: Videos & Practice Problems
24 of 0
Problem 24Multiple Choice
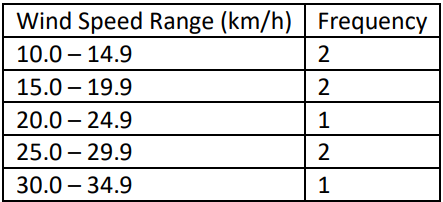
A meteorology team recorded the wind speeds (in km/h) of storms over a period of time. The frequency distribution of wind speeds is given below.

Using the frequency distribution above, find:
(i) The class limits of the first class
(ii) The class boundaries of the first class
(iii) The class midpoint of the first class
0 Comments