Table of contents
- 1. Intro to Stats and Collecting Data(0)
- 2. Describing Data with Tables and Graphs(0)
- 3. Describing Data Numerically(0)
- 4. Probability(0)
- 5. Binomial Distribution & Discrete Random Variables(0)
- 6. Normal Distribution and Continuous Random Variables(0)
- 7. Sampling Distributions & Confidence Intervals: Mean(0)
- 8. Sampling Distributions & Confidence Intervals: Proportion(0)
- 9. Hypothesis Testing for One Sample(0)
- 10. Hypothesis Testing for Two Samples(0)
- 11. Correlation(0)
- 12. Regression(0)
- 13. Chi-Square Tests & Goodness of Fit(0)
- 14. ANOVA(0)
3. Describing Data Numerically
Mean
3. Describing Data Numerically
Mean: Videos & Practice Problems
3 of 0
Problem 3Multiple Choice
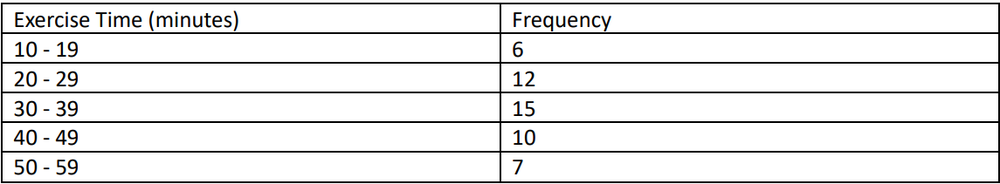
A study recorded the time (in minutes) spent on daily exercise by a group of 50 individuals. The collected data was summarized into the following frequency distribution:

Compute the mean of the data summarized in the frequency distribution.
Compare the computed mean to the actual mean obtained from the original list of data values, which is 31.2 minutes.
0 Comments