Table of contents
- 1. Intro to Stats and Collecting Data(0)
- 2. Describing Data with Tables and Graphs(0)
- 3. Describing Data Numerically(0)
- 4. Probability(0)
- 5. Binomial Distribution & Discrete Random Variables(0)
- 6. Normal Distribution and Continuous Random Variables(0)
- 7. Sampling Distributions & Confidence Intervals: Mean(0)
- 8. Sampling Distributions & Confidence Intervals: Proportion(0)
- 9. Hypothesis Testing for One Sample(0)
- 10. Hypothesis Testing for Two Samples(0)
- 11. Correlation(0)
- 12. Regression(0)
- 13. Chi-Square Tests & Goodness of Fit(0)
- 14. ANOVA(0)
11. Correlation
Scatterplots & Intro to Correlation
11. Correlation
Scatterplots & Intro to Correlation: Videos & Practice Problems
47 of 0
Problem 47Multiple Choice
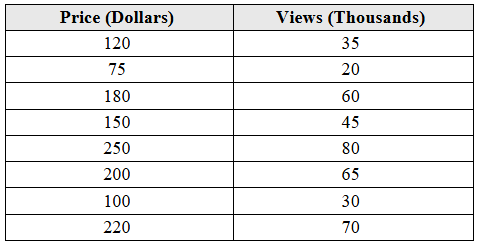
A local online marketplace tracks the relationship between the price of items listed for sale and the number of views they receive. The data below represents the price (in dollars) and the number of views (in thousands) for a random sample of recently listed items on the marketplace.

Draw a scatter diagram of the data, treating the price as the explanatory variable and views as the response variable.
0 Comments