Table of contents
- 1. Intro to Stats and Collecting Data(0)
- 2. Describing Data with Tables and Graphs(0)
- 3. Describing Data Numerically(0)
- 4. Probability(0)
- 5. Binomial Distribution & Discrete Random Variables(0)
- 6. Normal Distribution and Continuous Random Variables(0)
- 7. Sampling Distributions & Confidence Intervals: Mean(0)
- 8. Sampling Distributions & Confidence Intervals: Proportion(0)
- 9. Hypothesis Testing for One Sample(0)
- 10. Hypothesis Testing for Two Samples(0)
- 11. Correlation(0)
- 12. Regression(0)
- 13. Chi-Square Tests & Goodness of Fit(0)
- 14. ANOVA(0)
3. Describing Data Numerically
Boxplots
3. Describing Data Numerically
Boxplots: Videos & Practice Problems
8 of 0
Problem 8Multiple Choice
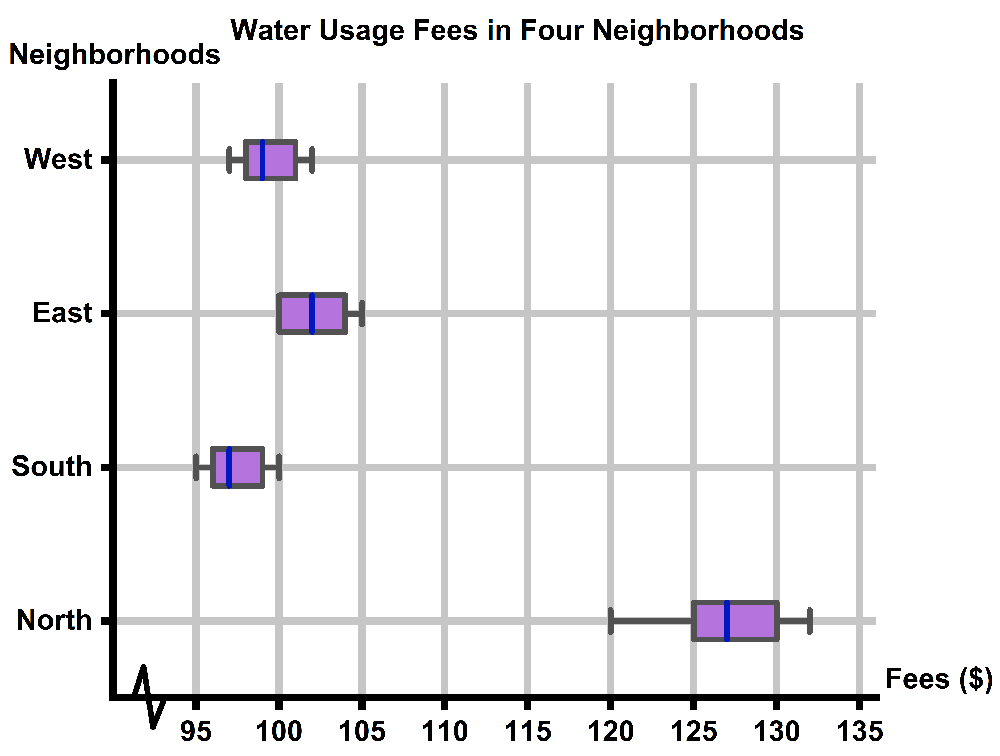
A city council is analyzing water usage fees in four different neighborhoods: North, South, East, and West. Residents of the North neighborhood have complained that their monthly water bills are higher than those in other areas. You collect a random sample of monthly water bills from each neighborhood, ensuring that all homes are of similar size and usage. Does it seem like North has higher bills? Use the box and whisker plot diagram below.

0 Comments