Table of contents
- 1. Intro to Stats and Collecting Data(0)
- 2. Describing Data with Tables and Graphs(0)
- 3. Describing Data Numerically(0)
- 4. Probability(0)
- 5. Binomial Distribution & Discrete Random Variables(0)
- 6. Normal Distribution and Continuous Random Variables(0)
- 7. Sampling Distributions & Confidence Intervals: Mean(0)
- 8. Sampling Distributions & Confidence Intervals: Proportion(0)
- 9. Hypothesis Testing for One Sample(0)
- 10. Hypothesis Testing for Two Samples(0)
- 11. Correlation(0)
- 12. Regression(0)
- 13. Chi-Square Tests & Goodness of Fit(0)
- 14. ANOVA(0)
12. Regression
Residuals
12. Regression
Residuals: Videos & Practice Problems

22 of 0
Problem 22Multiple Choice
The table shows the average vehicle age (in years) for each of the eight years. A regression model has been fit to the data:
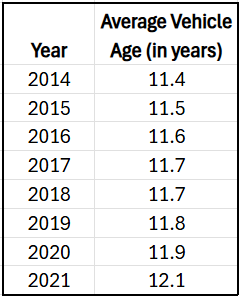
Using this regression model and the actual data, compute the standard error of estimate , which measures the typical distance between observed and predicted values.
0 Comments