Skip to main content
Statistics
My Course
Learn
Exam Prep
AI Tutor
Study Guides
Textbook Solutions
Flashcards
Explore
Try the app
My Course
Learn
Exam Prep
AI Tutor
Study Guides
Textbook Solutions
Flashcards
Explore
Try the app
Back
Confidence Intervals for Population Proportion - Excel quiz
You can tap to flip the card.
What are the two main components needed to construct a confidence interval for a population proportion?
You can tap to flip the card.
👆
What are the two main components needed to construct a confidence interval for a population proportion?
The two main components are the sample proportion (p̂) and the margin of error (e).
Track progress
Control buttons has been changed to "navigation" mode.
1/15
Related flashcards
Related practice
Recommended videos
Confidence Intervals for Population Proportion - Excel definitions
Confidence Intervals for Population Proportion - Excel
15 Terms
8. Sampling Distributions & Confidence Intervals: Proportion
1 topic
3 problems
Chapter
Ernest
05:49
Confidence Intervals for Population Prortion - Excel Example 1
107
views
2
rank
06:57
Confidence Intervals for Population Prortion - Excel
155
views
2
rank
Terms in this set (15)
Hide definitions
What are the two main components needed to construct a confidence interval for a population proportion?
The two main components are the sample proportion (p̂) and the margin of error (e).
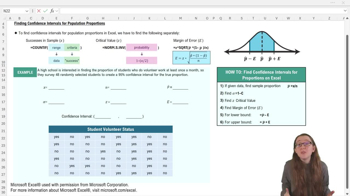
How do you calculate the sample proportion (p̂) in Excel?
Divide x, the number of successes, by n, the total sample size, using the formula =x/n.
Which Excel function can you use to count the number of 'yes' responses in a dataset?
You can use the COUNTIF function with the range and criteria inputs.
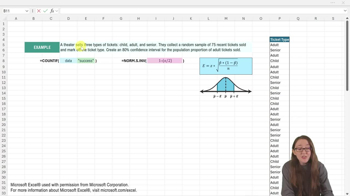
What is the formula for the margin of error (e) when constructing a confidence interval for a proportion?
The formula is e = z × sqrt(p̂ × (1 − p̂) / n).
How do you find the critical z-value in Excel for a given confidence level?
Use the NORM.S.INV function with the left-tail probability of 1 − α/2.
How do you calculate alpha (α) from the confidence level (c)?
Alpha is calculated as α = 1 − c.
If the confidence level is 95%, what is the value of alpha (α)?
Alpha is 0.05 when the confidence level is 95%.
What is the typical z critical value for a 95% confidence interval?
The typical z critical value is 1.96.
How do you calculate the lower bound of a confidence interval for a proportion in Excel?
Subtract the margin of error (e) from the sample proportion (p̂): =p̂−e.
How do you calculate the upper bound of a confidence interval for a proportion in Excel?
Add the margin of error (e) to the sample proportion (p̂): =p̂+e.
What does the COUNTIF function's 'criteria' input require in Excel?
The criteria input must be in quotation marks, such as "yes".
Why is it helpful to use Excel for counting responses in large datasets?
Excel reduces the risk of miscounting and automates the process efficiently.
What does a 95% confidence interval mean in the context of the high school volunteer example?
It means the school is 95% confident the true proportion of students who volunteer is between 0.28 and 0.56.
What Excel function is used to calculate the square root in the margin of error formula?
The SQRT function is used to calculate the square root.
What are the steps to assemble a confidence interval for a population proportion in Excel?
Find p̂, calculate the margin of error (e), then compute the lower and upper bounds as p̂−e and p̂+e.
 BackBack
 05:49
05:49