Skip to main content
Statistics
My Course
Learn
Exam Prep
AI Tutor
Study Guides
Textbook Solutions
Flashcards
Explore
Try the app
My Course
Learn
Exam Prep
AI Tutor
Study Guides
Textbook Solutions
Flashcards
Explore
Try the app
Back
Hypothesis Testing: Proportions - Excel quiz
You can tap to flip the card.
What is the null hypothesis (H0) when testing if the proportion of voters needing absentee ballots is less than 25%?
You can tap to flip the card.
👆
What is the null hypothesis (H0) when testing if the proportion of voters needing absentee ballots is less than 25%?
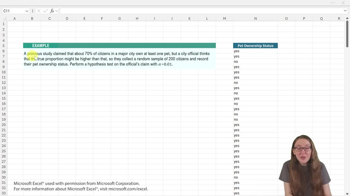
The null hypothesis is H0: p = 0.25, meaning the population proportion equals 0.25.
Track progress
Control buttons has been changed to "navigation" mode.
1/15
Related flashcards
Related practice
Recommended videos
Hypothesis Testing: Proportions - Excel definitions
Hypothesis Testing: Proportions - Excel
15 Terms
9. Hypothesis Testing for One Sample
1 topic
3 problems
Chapter
David-Paige
08:19
Performing Hypothesis Tests: Proportions - Excel
156
views
3
rank
08:31
Performing Hypothesis Tests: Proportions - Excel Example 1
126
views
2
rank
10:24
Performing Hypothesis Tests: Proportions - Excel Example 2
112
views
3
rank
Terms in this set (15)
Hide definitions
What is the null hypothesis (H0) when testing if the proportion of voters needing absentee ballots is less than 25%?
The null hypothesis is H0: p = 0.25, meaning the population proportion equals 0.25.
What is the alternative hypothesis (Ha) in this scenario?
The alternative hypothesis is Ha: p < 0.25, meaning the population proportion is less than 0.25.
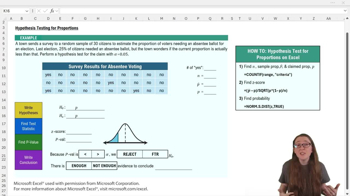
Which Excel function is used to count the number of 'yes' responses in a dataset?
The COUNTIF function is used to count the number of 'yes' responses.
How do you calculate the sample proportion (p̂) in Excel?
Divide the number of 'yes' responses by the sample size n to get p̂.
What is the formula for the z-score in a population proportion hypothesis test?
The formula is z = (p̂ - p) / sqrt[p(1-p)/n].
Which Excel function is used to calculate the p-value from a z-score for a left-tailed test?
The NORM.S.DIST function is used with the z-score and TRUE for cumulative probability.
What does it mean if the p-value is greater than the significance level alpha?
If the p-value is greater than alpha, you fail to reject the null hypothesis.
What is the significance level (alpha) commonly used in hypothesis testing?
A common significance level is alpha = 0.05.
How do you interpret the result if you fail to reject the null hypothesis?
There is not enough evidence to support the alternative hypothesis.
What value did the sample proportion (p̂) have in the example provided?
The sample proportion was approximately 0.133.
What was the calculated z-score in the example?
The z-score was about -1.48.
What was the calculated p-value in the example?
The p-value was approximately 0.07.
What sample size (n) was used in the example?
The sample size was 30.
What is the purpose of using quotation marks in the COUNTIF function when searching for 'yes'?
Quotation marks tell Excel to look for the text 'yes' specifically.
What conclusion was reached in the example based on the hypothesis test results?
The conclusion was to fail to reject the null hypothesis, meaning there is not enough evidence that the proportion is less than 0.25.
 BackBack
 08:19
08:19