Skip to main content
Statistics
My Course
Learn
Exam Prep
AI Tutor
Study Guides
Textbook Solutions
Flashcards
Explore
Try the app
My Course
Learn
Exam Prep
AI Tutor
Study Guides
Textbook Solutions
Flashcards
Explore
Try the app
Back
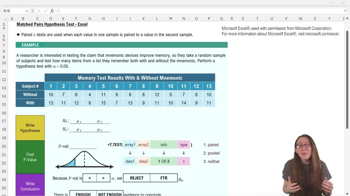
Matched Pairs Hypothesis Test - Excel definitions
You can tap to flip the card.
Pooled t test
You can tap to flip the card.
👆
Pooled t test
Statistical method for comparing two means when population variances are unknown but assumed equal.
Track progress
Control buttons has been changed to "navigation" mode.
1/15
Related flashcards
Related practice
Recommended videos
Matched Pairs Hypothesis Test - Excel quiz
Matched Pairs Hypothesis Test - Excel
15 Terms
10. Hypothesis Testing for Two Samples
3 topics
6 problems
Chapter
Brendan
04:22
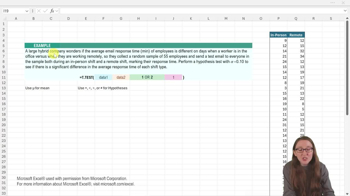
Matched Pairs Hypothesis Test - Excel Example 2
72
views
03:51
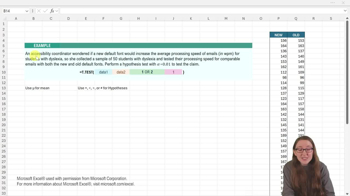
Matched Pairs Hypothesis Test - Excel Example 1
82
views
1
rank
04:03
Matched Pairs Hypothesis Test - Excel
93
views
1
rank
Terms in this set (15)
Hide definitions
Pooled t test
Statistical method for comparing two means when population variances are unknown but assumed equal.
Population variance
Measure of spread within a population, assumed equal in pooled t test scenarios.
Null hypothesis
Statement asserting no difference between two population means in hypothesis testing.
Alternative hypothesis
Claim suggesting a difference exists between two population means.
Significance level
Threshold, often denoted as alpha, used to determine if results are statistically significant.
p-value
Probability indicating the strength of evidence against the null hypothesis.
Two-tail test
Test that checks for any difference between means, regardless of direction.
Excel t.test function
Tool in Excel for performing t tests, with input options for test type and tail direction.
Random sample
Subset of data selected to represent a population, used for unbiased statistical analysis.
Average
Mean value calculated from a set of data, central to comparing groups in t tests.
Type input
Parameter in Excel’s t.test function specifying the test variant, such as pooled t test.
Hypothesis test
Procedure for evaluating claims about population parameters using sample data.
Alpha
Symbol representing the significance level, commonly set at 0.05 in hypothesis testing.
Mu
Symbol used to denote the mean of a population in statistical formulas.
Conclusion
Final statement summarizing results of hypothesis testing based on p-value and significance level.
 BackBack
 04:22
04:22