Skip to main content
Statistics
My Course
Learn
Exam Prep
AI Tutor
Study Guides
Textbook Solutions
Flashcards
Explore
Try the app
My Course
Learn
Exam Prep
AI Tutor
Study Guides
Textbook Solutions
Flashcards
Explore
Try the app
Back
Two Means - Sigma Known Hypothesis Test - Excel definitions
You can tap to flip the card.
Population Standard Deviation
You can tap to flip the card.
👆
Population Standard Deviation
A fixed measure of variability for an entire group, used when calculating test statistics for hypothesis tests.
Track progress
Control buttons has been changed to "navigation" mode.
1/15
Related flashcards
Related practice
Recommended videos
Two Means - Sigma Known Hypothesis Test - Excel quiz
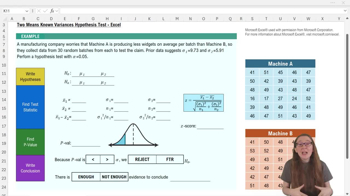
Two Means - Sigma Known Hypothesis Test - Excel
15 Terms
Two Means - Matched Pairs (Dependent Samples)
10. Hypothesis Testing for Two Samples
3 problems
Topic
Brendan
10. Hypothesis Testing for Two Samples
3 topics
6 problems
Chapter
Brendan
06:59
Two Means -Sigma Known Hypothesis Test - Excel Example 2
68
views
07:32
Two Means -Sigma Known Hypothesis Test - Excel
91
views
06:30
Two Means -Sigma Known Hypothesis Test - Excel Example 1
79
views
Terms in this set (15)
Hide definitions
Population Standard Deviation
A fixed measure of variability for an entire group, used when calculating test statistics for hypothesis tests.
Normal Distribution
A symmetric, bell-shaped curve used for statistical inference when population variability is known.
Z-Test
A statistical method for comparing two means when population variability is known, relying on the normal curve.
Null Hypothesis
A statement asserting no difference between two group averages, serving as the default assumption in testing.
Alternative Hypothesis
A claim suggesting a difference or direction between two group averages, tested against the default assumption.
Sample Mean
An average calculated from collected data, representing the central value for a group in hypothesis testing.
Sample Size
The number of observations in a group, influencing the precision of statistical calculations.
Z-Score
A value quantifying how far apart two sample averages are, standardized by known variability and sample sizes.
P-Value
A probability indicating how likely observed results are under the default assumption, guiding decision-making.
Alpha
A threshold probability for deciding whether to reject the default assumption, commonly set at 0.05.
Cumulative Probability
A measure from the normal curve representing the likelihood of observing a value as extreme or more.
Left Tail
The portion of the normal curve representing values less than a specified point, used for one-sided tests.
Excel Function
A built-in tool in spreadsheet software for automating calculations such as averages or probabilities.
NORM.S.DIST
A spreadsheet command for finding cumulative probabilities from the standard normal curve.
Hypothesis Test
A structured process for evaluating claims about group averages using statistical evidence.
 BackBack
 06:59
06:59