Skip to main content
Statistics
My Course
Learn
Exam Prep
AI Tutor
Study Guides
Textbook Solutions
Flashcards
Explore
Try the app
My Course
Learn
Exam Prep
AI Tutor
Study Guides
Textbook Solutions
Flashcards
Explore
Try the app
Back
Two Means - Unknown Variances Hypothesis Test - Excel definitions
You can tap to flip the card.
Hypothesis Test
You can tap to flip the card.
👆
Hypothesis Test
A statistical procedure used to assess claims about population parameters based on sample data.
Track progress
Control buttons has been changed to "navigation" mode.
1/15
Related flashcards
Related practice
Recommended videos
Two Means - Unknown Variances Hypothesis Test - Excel quiz
Two Means - Unknown Variances Hypothesis Test - Excel
15 Terms
10. Hypothesis Testing for Two Samples
3 topics
6 problems
Chapter
Brendan
04:43
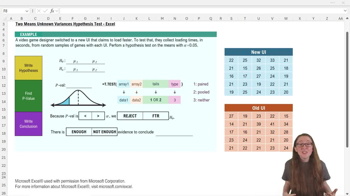
Two Means - Unknown Variances Hypthesis Test - Excel
110
views
04:08
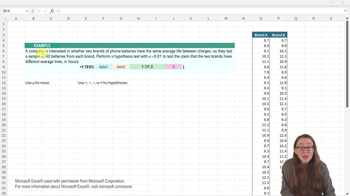
Two Means - Unknown Variances Hypthesis Test - Excel Example 1
84
views
03:50
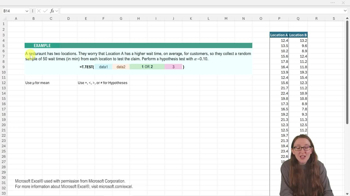
Two Means - Unknown Variances Hypthesis Test - Excel Example 2
76
views
Terms in this set (15)
Hide definitions
Hypothesis Test
A statistical procedure used to assess claims about population parameters based on sample data.
Null Hypothesis
A statement asserting no difference or effect, serving as the default assumption in statistical testing.
Alternative Hypothesis
A claim suggesting a difference or effect, representing what evidence is sought for in a test.
Population Mean
The average value of a variable across all members of a population.
Significance Level
A threshold probability, often denoted as alpha, used to determine whether to reject the null hypothesis.
P-value
A calculated probability indicating the strength of evidence against the null hypothesis.
T.TEST Function
An Excel tool that computes the p-value for comparing two data sets, streamlining hypothesis testing.
Data Array
A collection of values representing sample observations for statistical analysis.
Tail
A region of a probability distribution used to define the directionality of a hypothesis test.
Two-tailed Test
A test considering deviations in both directions from the hypothesized value.
One-tailed Test
A test focusing on deviations in a single direction from the hypothesized value.
Type
An input in Excel's t-test specifying the test variant, such as regular, paired, or pooled.
Paired Test
A special t-test variant comparing matched or related samples.
Pooled Test
A t-test variant assuming equal variances across groups for combined analysis.
Conclusion
A final statement summarizing the outcome of a hypothesis test based on p-value and significance level.
 BackBack
 04:43
04:43