Textbook Question
True or False? In Exercises 1 and 2, determine whether the statement is true or false. If it is false, rewrite it as a true statement.
The point estimate for the population proportion of failures is 1-p^
88
views

 Verified step by step guidance
 06:33 06:33
 04:08
04:08True or False? In Exercises 1 and 2, determine whether the statement is true or false. If it is false, rewrite it as a true statement.
The point estimate for the population proportion of failures is 1-p^
Bisexual Idenfitication In a survey of 692 lesbian, gay, bisexual, or transgender U.S adults, 378 said that they consider themselves bisexual. Construct a 90% confidence interval for the population proportion of lesbian, gay, bisexual, or transgender U.S. adults who consider themselves bisexual. (Adapted from Gallup)
What happens to the shape of the chi-square distribution as the degrees of freedom increase?
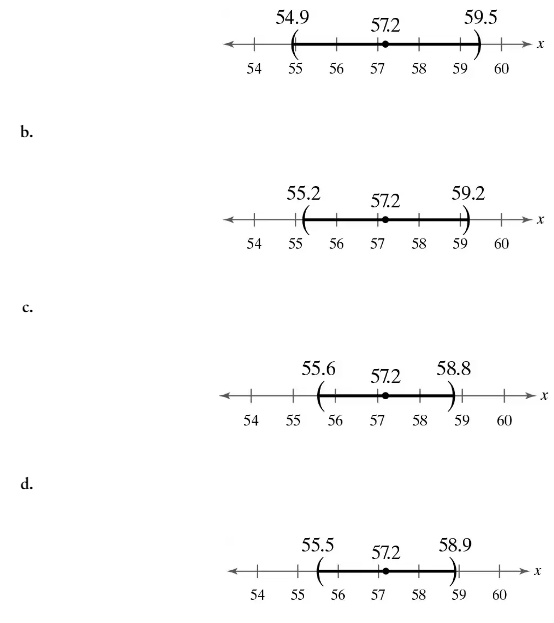
Translating Statements In Exercises 29–34, translate the statement into a confidence interval. Approximate the level of confidence.
In a survey of 2094 U.S. adults who have used an online dating app, 57% said their personal experience with online dating was positive. The survey’s margin of error is ±3.6%. (Source: Pew Research Center)
In Exercises 29–32, determine the minimum sample size n needed to estimate for the values of c, σ, and E.
c = 0.80, σ = 4.1, E = 2.
In Exercise 31, the population mean salary is \$67,319. Does the t-value fall between -t0.98 and t0.98? (Source: Salary.com)