


 06:28
06:28

Textbook Question
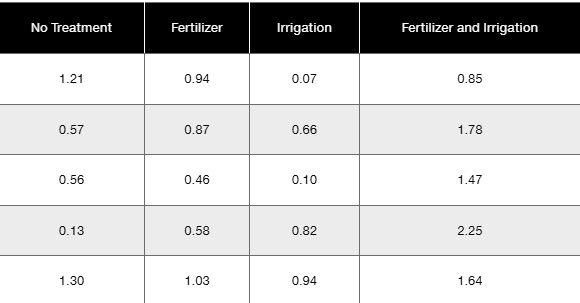
In Exercises 1–5, refer to the following list of numbers of years that deceased U.S. presidents, popes, and British monarchs lived after their inauguration, election, or coronation, respectively. (As of this writing, the last president is George H. W. Bush, the last pope is John Paul II, and the last British monarch is George VI.) Assume that the data are samples from larger populations.
[Image]
Exploring the Data Include appropriate units in all answers.
d. Are there any obvious outliers?
132
views