


 06:39
06:39

Textbook Question
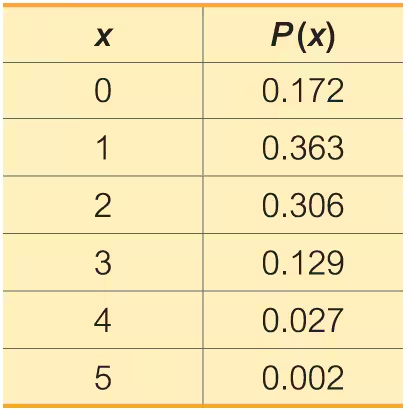
In Exercises 1–5, assume that 4.2% of workers test positive when tested for illegal drugs (based on data from Quest Diagnostics). Assume that a group of ten workers is randomly selected.
Workplace Drug Testing If none of the ten workers tests positive for illegal drugs, is that a significantly low result?
132
views