In Exercises 21–40, eliminate the parameter t. Then use the rectangular equation to sketch the plane curve represented by the given parametric equations. Use arrows to show the orientation of the curve corresponding to increasing values of t. (If an interval for t is not specified, assume that −∞ < t < ∞. x = 2ᵗ, y = 2⁻ᵗ; t ≥ 0
Table of contents
- 0. Review of College Algebra4h 45m
- 1. Measuring Angles40m
- 2. Trigonometric Functions on Right Triangles2h 5m
- 3. Unit Circle1h 19m
- 4. Graphing Trigonometric Functions1h 19m
- 5. Inverse Trigonometric Functions and Basic Trigonometric Equations1h 41m
- 6. Trigonometric Identities and More Equations2h 34m
- 7. Non-Right Triangles1h 38m
- 8. Vectors2h 25m
- 9. Polar Equations2h 5m
- 10. Parametric Equations1h 6m
- 11. Graphing Complex Numbers1h 7m
10. Parametric Equations
Graphing Parametric Equations
Multiple Choice
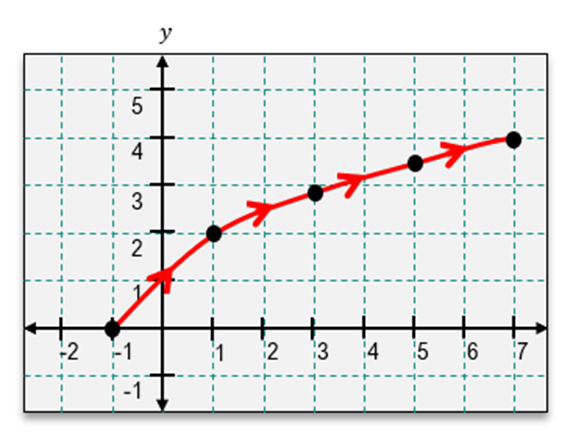
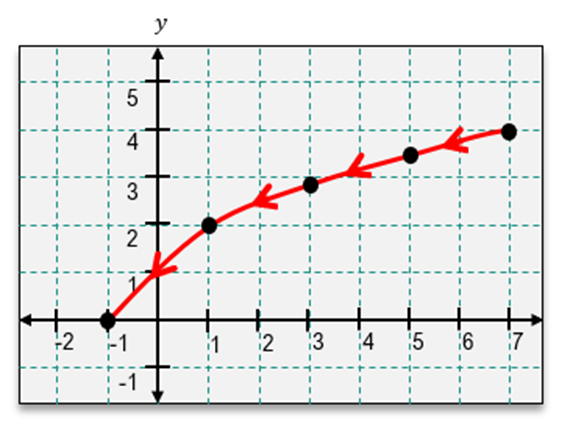
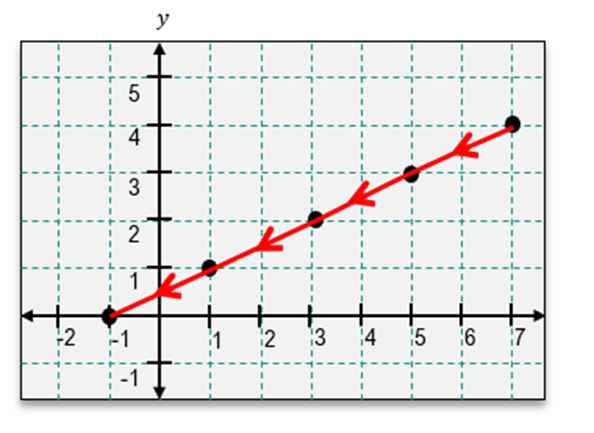
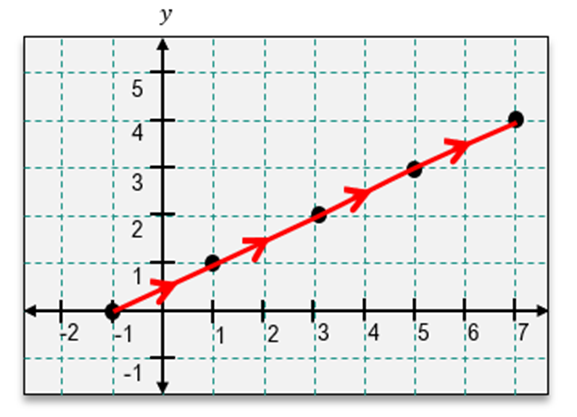
Graph the plane curve formed by the parametric equations and indicate its orientation.
;
A
B
C
D
0 Comments
Verified step by step guidance1
Identify the parametric equations given: x(t) = 2t - 1 and y(t) = 2\(\sqrt{t}\), with the condition t \(\geq\) 0.
Determine the range of t to plot the curve. Since t \(\geq\) 0, start with t = 0 and choose a few positive values for t to calculate corresponding x and y values.
Calculate the x and y coordinates for selected values of t. For example, when t = 0, x(0) = 2(0) - 1 = -1 and y(0) = 2\(\sqrt{0}\) = 0. Repeat for other values of t like 1, 2, 3, etc.
Plot the calculated points (x, y) on the coordinate plane. For instance, plot (-1, 0), (1, 2), (3, 2.83), etc., based on your calculations.
Draw a smooth curve through the plotted points and indicate the orientation of the curve by drawing arrows in the direction of increasing t, which is from left to right in this case.
Related Videos
Related Practice
Textbook Question
769
views