In Exercises 18–24, graph two full periods of the given tangent or cotangent function. y = − 1/2 cot π/2 x
Verified step by step guidance
1
Identify the given function: \(y = -\frac{1}{2} \cot\left(\frac{\pi}{2} x\right)\). This is a cotangent function with a vertical stretch/compression and reflection.
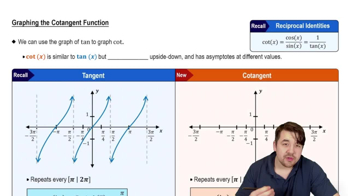
Determine the period of the cotangent function. The general period of \(\cot(bx)\) is \(\frac{\pi}{b}\). Here, \(b = \frac{\pi}{2}\), so the period is \(\frac{\pi}{\frac{\pi}{2}} = 2\).
Since the problem asks for two full periods, calculate the interval for \(x\) over which to graph: from \(0\) to \(2 \times 2 = 4\).
Identify the vertical asymptotes of the cotangent function. For \(\cot(bx)\), asymptotes occur where \(bx = k\pi\), for integers \(k\). Solve \(\frac{\pi}{2} x = k\pi\) to find \(x = 2k\).
Plot key points between asymptotes, considering the reflection and vertical compression by \(-\frac{1}{2}\). The cotangent normally decreases from \(+\infty\) to \(-\infty\) between asymptotes; here it will be reflected and scaled accordingly.
Verified video answer for a similar problem:
This video solution was recommended by our tutors as helpful for the problem above
Video duration:
7m
Play a video:
0 Comments
Key Concepts
Here are the essential concepts you must grasp in order to answer the question correctly.
Period of Cotangent Function
The period of the basic cotangent function, cot(x), is π. When the function is transformed as cot(bx), the period changes to π divided by the absolute value of b. Understanding this helps determine the length of one full cycle on the x-axis, which is essential for graphing two full periods.
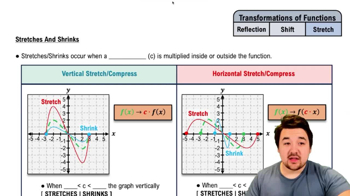
The coefficient in front of the cotangent function, such as -1/2, affects the vertical stretch or compression and reflection. Here, -1/2 reflects the graph across the x-axis and compresses it vertically by a factor of 1/2, altering the shape but not the period or asymptotes.
Cotangent functions have vertical asymptotes where the function is undefined, typically at multiples of the period. Identifying these asymptotes and key points like zeros helps in accurately sketching the graph. For cot(bx), asymptotes occur where bx equals multiples of π, guiding the placement of vertical lines.