
Textbook Question
For each equation, (a) give a table with at least three ordered pairs that are solutions, and (b) graph the equation. See Examples 3 and 4.
y = √(x - 3)
658
views
 Verified step by step guidanceVerified video answer for a similar problem:
 06:03
06:03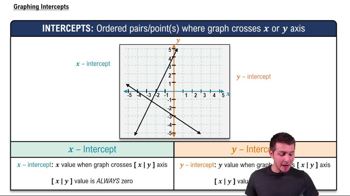 4:08
4:08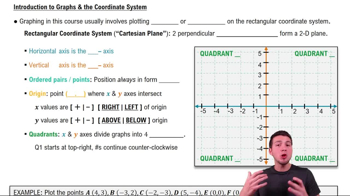 5:10
5:10