 Back
BackData Handling, Errors, and Statistics in Analytical Chemistry
Study Guide - Smart Notes
 Tailored notes based on your materials, expanded with key definitions, examples, and context.
Data Handling, Errors of Analyses, and Statistics
Significant Figures
Significant figures are the meaningful digits in a measured or calculated quantity, reflecting the precision of the measurement. The last digit is always uncertain, representing the measurement's inherent uncertainty.
Definition: The number of digits necessary to express the results of a measurement consistent with the measured precision.
Guidelines:
All nonzero digits are significant.
Zeros between nonzero digits are significant.
For numbers >1, zeros to the right of the decimal are significant.
For numbers <1, only zeros at the end or between nonzero digits are significant.
Trailing zeros in numbers without decimals may or may not be significant (use scientific notation for clarity).
Exact numbers (from definitions or counting) have infinite significant figures.
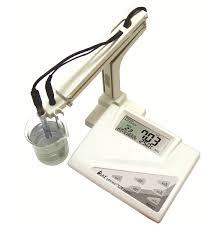
Uncertainty Example: Measuring 6 mL in a graduated cylinder with different precisions: 6 ± 1 mL (low precision), 6.0 ± 0.1 mL (high precision).

Significant Figures in Mathematical Operations
When performing calculations, the number of significant figures in the result is determined by the least precise measurement.
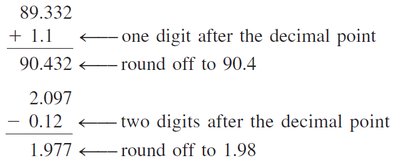
Addition/Subtraction: The answer cannot have more digits to the right of the decimal point than the least precise measurement.
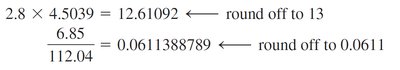
Multiplication/Division: The answer is limited by the original number with the smallest number of significant figures.
Rounding Off Numbers
If the first digit dropped is less than 5, drop all following digits.
If the first digit dropped is greater than 5, add 1 to the preceding digit.
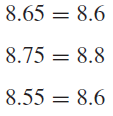
If the digit dropped is exactly 5, round to the nearest even digit.
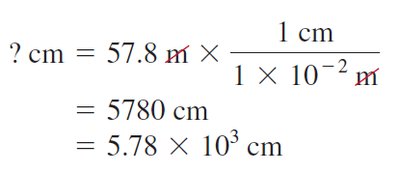
Dimensional Analysis and Counting Numbers
Dimensional analysis ensures units are consistent in calculations. Counting numbers (e.g., number of objects) are exact and do not limit significant figures.
Accuracy and Precision
Accuracy and precision are fundamental concepts in analytical chemistry, describing the quality of measurements.
Accuracy: Degree of agreement between a measured value and the true or accepted value.
Precision: Degree of agreement among replicate measurements of the same quantity; a measure of reproducibility.


Expressing Accuracy and Precision
Absolute Error: Difference between true value and measured value.
Relative Error:
Relative Accuracy:
Precision: Expressed as standard deviation, coefficient of variation, range, or confidence interval.
Types of Errors in Analysis
Errors affect the accuracy and precision of analytical results and are classified as determinate (systematic) or indeterminate (random).
Determinate (Systematic) Errors: Reproducible errors that can be identified and corrected. They lead to bias in results.
Indeterminate (Random) Errors: Unpredictable variations that arise from uncontrollable factors. They affect precision but not accuracy.
Sources of Determinate Errors
Instrumental Errors: Caused by faulty calibration, non-ideal instrument behavior, or inappropriate use.
Method Errors: Due to incomplete reactions, instability, lack of specificity, or side reactions.
Personal Errors: Result from human judgment, such as reading instruments or determining endpoints.

Detection and Correction of Systematic Errors
Analysis of standard samples
Independent analysis using different methods
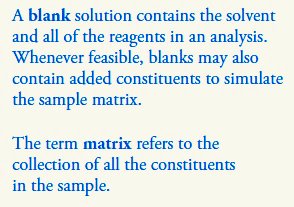
Blank determinations to correct for contamination
Variation in sample size to detect sample-related errors
Statistical Terms and Central Tendency
Statistics are used to evaluate the reliability and accuracy of analytical results.
Mean (\(\bar{X}\)): Arithmetic average of a data set.
Median: Middle value when data are ordered.
Range: Difference between the largest and smallest values.
Measures of Spread
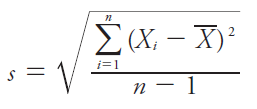
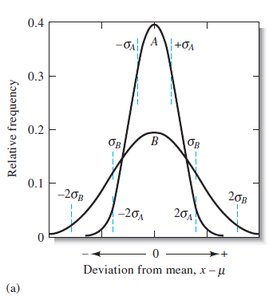
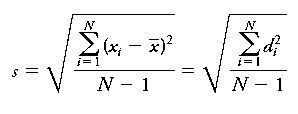
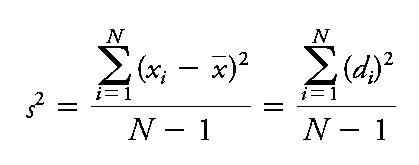
Standard Deviation (s): Measures the spread of values about the mean.
Variance (s2): Square of the standard deviation.
Relative Standard Deviation (RSD):
Coefficient of Variation (CV):

Random (Indeterminate) Errors and Distributions
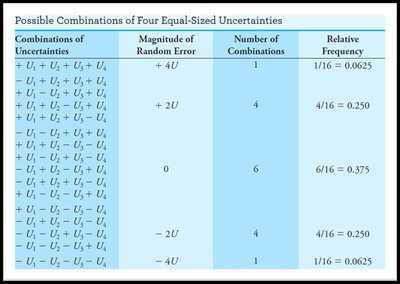
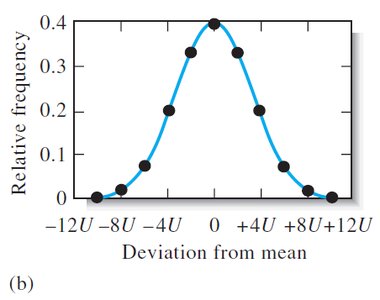
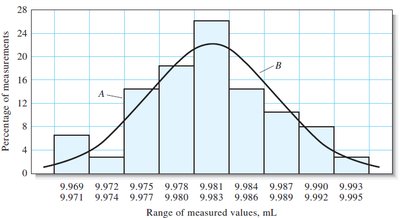
Random errors cause scatter in replicate measurements and are described statistically by frequency distributions.
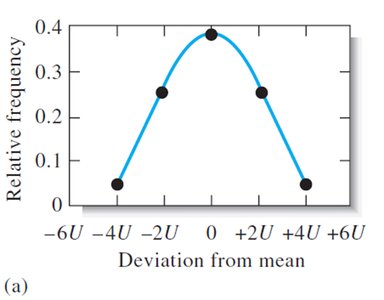
With increasing number of measurements, the distribution approaches a Gaussian (normal) curve.
Random errors are minimized but never eliminated.
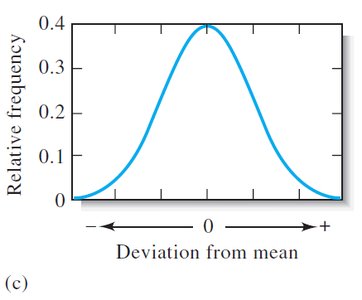
Gaussian (Normal) Distribution
The Gaussian distribution describes the probability of obtaining a particular value in a set of measurements affected only by random error.
Equation:
Parameters: Population mean (\(\mu\)), population standard deviation (\(\sigma\))
Sample and Population Statistics
Sample Mean (\(\overline{X}\)):
Population Mean (\(\mu\)):
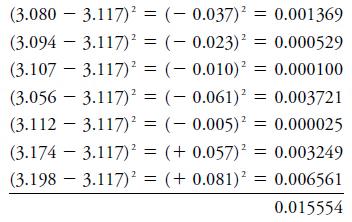
Sample Standard Deviation (s):
Population Standard Deviation (\(\sigma\)):
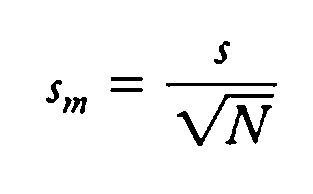
Standard Error of the Mean and Pooled Standard Deviation
Standard Error of the Mean:
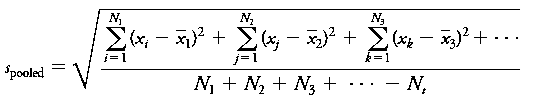
Pooled Standard Deviation:
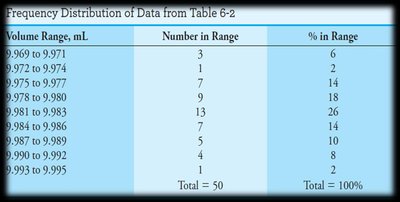
Frequency Distributions and Data Visualization
Frequency distributions and histograms are used to visualize the spread and central tendency of data, often compared to the ideal Gaussian curve.
Summary Table: Types of Errors and Their Effects
Error Type | Source | Effect | Correction |
|---|---|---|---|
Determinate (Systematic) | Instrument, Method, Personal | Bias (affects accuracy) | Calibration, method validation, training |
Indeterminate (Random) | Uncontrollable factors | Scatter (affects precision) | Statistical analysis, replicate measurements |
