 Back
BackElectromyography II: Motor Unit Recruitment and Fatigue – Study Notes
Study Guide - Smart Notes
 Tailored notes based on your materials, expanded with key definitions, examples, and context.
Electromyography (EMG) II: Motor Unit Recruitment and Fatigue
Introduction to Electromyography (EMG)
Electromyography (EMG) is a technique used to record and analyze the electrical activity produced by skeletal muscles. This lesson focuses on understanding motor unit recruitment and muscle fatigue through EMG data analysis, using both dominant and nondominant arms.
EMG: Records the electrical activity of skeletal muscle fibers during contraction and relaxation.
Dynamometry: The measurement of muscle force, often used in conjunction with EMG to assess muscle performance.
Data Analysis Procedures in EMG Experiments
Setting Up and Reviewing Data
Data analysis begins by entering the Review Saved Data mode in the Biopac Student Lab software. The software displays multiple channels, each representing different measurements:
CH 1: Raw EMG signal (often hidden for clarity)
CH 40: Integrated EMG (summed electrical activity over time)
CH 41: Clench Force (muscle force output)
Measurement types include:
Mean: Average value in the selected area
Value: Amplitude at a specific point or endpoint of a selected area
Delta T: Time difference between the start and end of a selected area
The I-Beam cursor is used to select regions of interest for analysis.
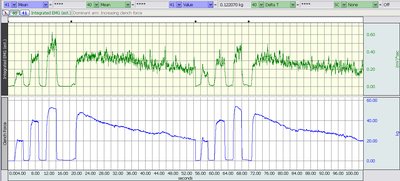
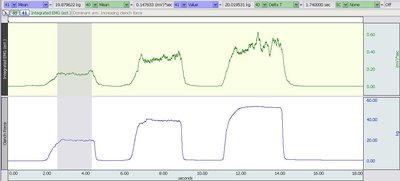
Analysis of Increasing Clench Force
To analyze motor unit recruitment, students incrementally increase clench force with both dominant and nondominant arms. The force increment is noted and used to fill out data tables for each peak force achieved.
Event markers indicate the start of each recording.
Display tools (autoscale, zoom, scroll bars) help optimize data visualization.
Force increments are recorded for each peak and used to compare muscle performance between arms.
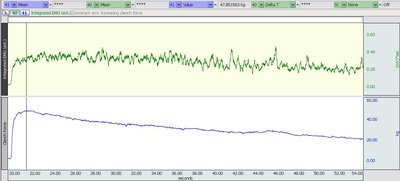
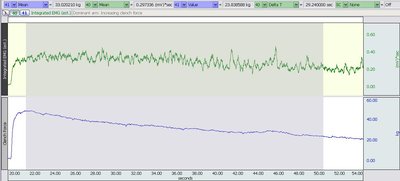
Analysis of Continued Clench and Fatigue
Fatigue is assessed by maintaining a maximal clench and measuring the time until force drops to 50% of the maximum. This is repeated for both arms.
Maximal clench force is identified at the start of the recording.
50% of maximal force is calculated and located using the cursor.
The time from maximal force to 50% force (time to fatigue) is measured using Delta T.
Key Concepts and Definitions
Motor Unit and Motor Unit Recruitment
Motor Unit: One motor neuron and all the skeletal muscle fibers it innervates.
Motor Unit Recruitment: The activation of additional motor units to increase muscle contraction strength.
Fatigue
Fatigue: The decline in muscle force output over time, often due to depletion of ATP and reduced calcium release.
EMG and Dynamometry
EMG: Electromyography records the electrical activity of skeletal muscle.
Dynamometry: The measurement of muscle force.
Data Tables
Table 1: Increasing Clench Force Data
This table is used to record force and integrated EMG values at each peak during incremental clenching for both arms.
Peak # | Assigned Force Increment | Force at Peak (Dominant arm) | Integrated EMG (Dominant arm) | Force at Peak (Nondominant arm) | Integrated EMG (Nondominant arm) |
|---|---|---|---|---|---|
1 | 4.210 | 0.057 | 8.900 | 0.109 | |
2 | 12.731 | 0.153 | 17.433 | 0.200 | |
3 | 4.023 | 0.086 | 4.618 | 0.089 | |
4 | 7.175 | 0.122 | 11.019 | 0.177 | |
5 | 8.420 | 16.776 | 5.315 | 16.774 | |
6 | 4.210 | 2.658 |
Table 2: Maximum Clench Force and Fatigue Data
Maximum Clench Force | 50% of Max Clench Force | Time to Fatigue | |
|---|---|---|---|
Dominant arm | 8.420 | 4.210 | 16.776 |
Nondominant arm | 5.315 | 2.658 | 16.774 |
Discussion Questions and Key Points
Is the strength of your right arm different than your left arm? – Often, the dominant arm is stronger due to greater muscle mass and usage.
Is there a difference in force generated by males and females? – Yes; explained by greater muscle mass, sectional area, and higher testosterone levels in males, leading to more muscle protein synthesis.
Do the same motor units remain active when holding an object? – No; motor units take turns to prevent fatigue.
What physiological processes explain fatigue? – Depletion of ATP and reduced calcium release in muscle fibers.
Summary
This lesson provides hands-on experience with EMG and dynamometry to study motor unit recruitment and muscle fatigue. By analyzing force and EMG data, students gain insight into the physiological mechanisms underlying muscle contraction and endurance.
