 Back
BackGraphing Linear Equations Using Intercepts
Study Guide - Smart Notes
 Tailored notes based on your materials, expanded with key definitions, examples, and context.
Graphing Linear Equations Using Intercepts
Introduction to Linear Equations and Intercepts
Linear equations in two variables can be represented graphically as straight lines. The standard form of a linear equation is Ax + By = C, where A and B are not both zero. To graph these equations efficiently, we use two key points: the x-intercept and the y-intercept.
Identifying Intercepts
X-Intercept
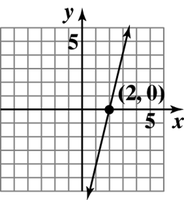
The x-intercept is the point where the graph of an equation crosses the x-axis. At this point, the value of y is always zero. To find the x-intercept, set y = 0 in the equation and solve for x.
Definition: The x-coordinate of the point where the graph crosses the x-axis (y = 0).
Example: The graph crosses the x-axis at (2, 0), so the x-intercept is 2.
Y-Intercept
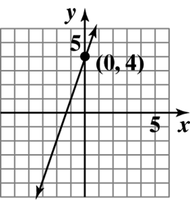
The y-intercept is the point where the graph of an equation crosses the y-axis. At this point, the value of x is always zero. To find the y-intercept, set x = 0 in the equation and solve for y.
Definition: The y-coordinate of the point where the graph crosses the y-axis (x = 0).
Example: The graph crosses the y-axis at (0, 4), so the y-intercept is 4.
Examples: Identifying Intercepts from Graphs
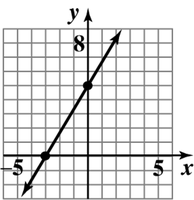
Example 1: The graph crosses the x-axis at (-3, 0) and the y-axis at (0, 5). Thus, the x-intercept is -3 and the y-intercept is 5.
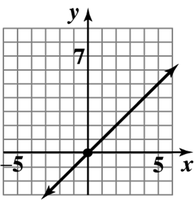
Example 2: The graph crosses both axes at (0, 0). Thus, both the x-intercept and y-intercept are 0.
Graphing Linear Equations Using Intercepts
Procedure for Graphing
To graph a linear equation in two variables using intercepts, follow these steps:
Find the x-intercept: Set y = 0 and solve for x.
Find the y-intercept: Set x = 0 and solve for y.
Find a checkpoint: Choose another value for x (or y), substitute it into the equation, and solve for the other variable to get a third point.
Draw the line: Plot the intercepts and the checkpoint, then draw a straight line through them.
Example: Graphing with Intercepts and a Checkpoint
Equation: Suppose we have a linear equation.
Step 1: Find the x-intercept by letting y = 0 and solving for x.
Step 2: Find the y-intercept by letting x = 0 and solving for y.
Step 3: Find a checkpoint by choosing another value for x (e.g., x = 1) and solving for y.
Step 4: Plot the points and draw the line.
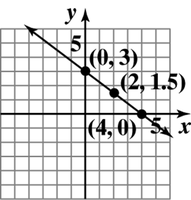
Example: For a line passing through (4, 0), (0, 3), and (2, 1.5):
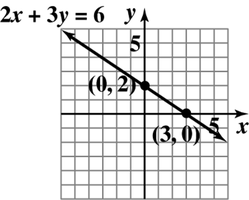
Example: Graphing 2x + 3y = 6
x-intercept: Set y = 0:
y-intercept: Set x = 0:
Checkpoint: Choose x = 1:
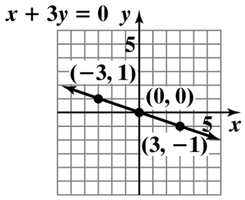
Example: Graphing x + 3y = 0
x-intercept: Set y = 0:
y-intercept: Set x = 0:
Additional points: For y = -1, ; for y = 1,
Use the points (0, 0), (3, -1), and (-3, 1) to draw the line.
Graphing Horizontal and Vertical Lines
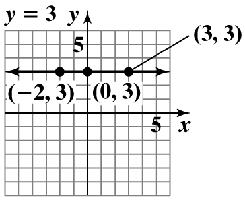
Horizontal Lines
A horizontal line has the equation y = k, where k is a constant. All points on the line have the same y-value, and the line is parallel to the x-axis.
Example: y = 3. All points have y = 3, such as (-2, 3), (0, 3), and (3, 3).
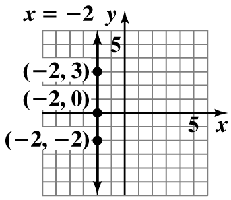
Vertical Lines
A vertical line has the equation x = h, where h is a constant. All points on the line have the same x-value, and the line is parallel to the y-axis.
Example: x = -2. All points have x = -2, such as (-2, 3), (-2, 0), and (-2, -2).
Summary Table: Intercepts and Line Types
Type of Line | Equation Form | Intercepts | Graph Description |
|---|---|---|---|
General Linear | Ax + By = C | x-intercept: set y=0 y-intercept: set x=0 | Straight line, not vertical or horizontal |
Horizontal | y = k | y-intercept: (0, k) | Parallel to x-axis |
Vertical | x = h | x-intercept: (h, 0) | Parallel to y-axis |
Additional info: Checkpoints are used to confirm the accuracy of the line and to provide a third point for more precise graphing. For equations where the constant term is zero, the line passes through the origin (0, 0).
