 Back
BackStudy Guide: Linear Equations in Two Variables, Graphing, and Midpoint & Slope Concepts
Study Guide - Smart Notes
 Tailored notes based on your materials, expanded with key definitions, examples, and context.
Linear Equations in Two Variables
Standard Form of a Linear Equation
A linear equation in two variables can be written in the form , where A, B, and C are real numbers and A and B are not both zero. This form is called standard form.
Standard Form:
Variables: x and y
Coefficients: A, B, C (real numbers)
Intercepts
Two useful points for graphing are the x-intercept and y-intercept. The x-intercept is found by setting , and the y-intercept is found by setting .
x-intercept: Let and solve for .
y-intercept: Let and solve for .
Example: Finding Intercepts and Graphing
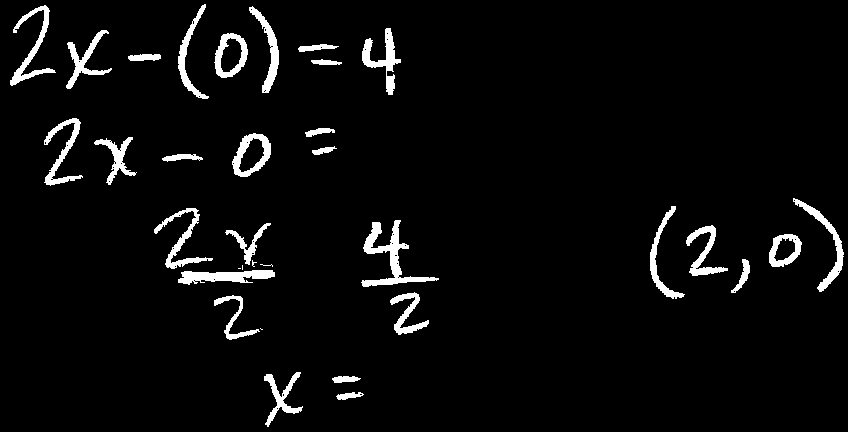
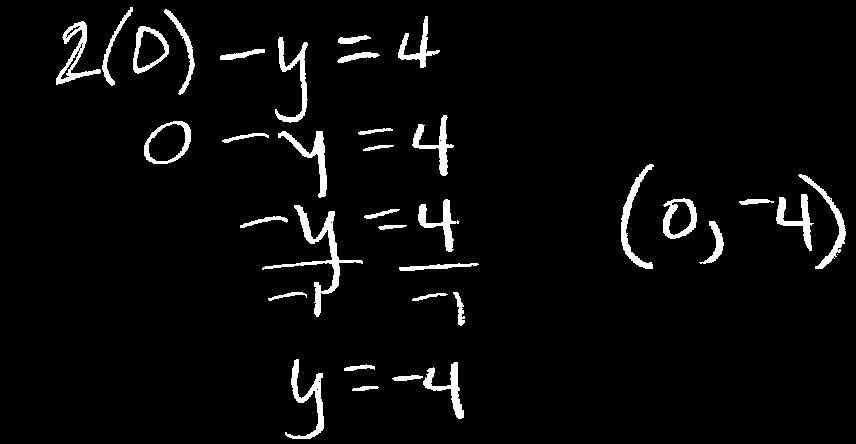
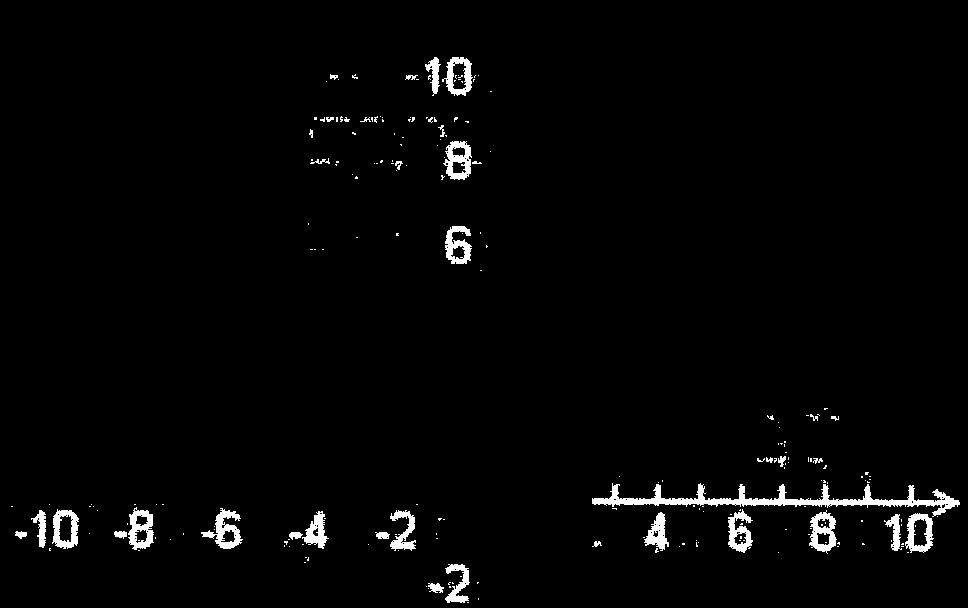
Find the x- and y-intercepts and graph the equation .
x-intercept:
y-intercept:
Special Cases: Equations with One Variable
Horizontal and Vertical Lines
If the equation to be graphed is "missing" a variable, it represents a special case:
Horizontal line: (missing x)
Vertical line: (missing y)
Graphing Linear Equations
Graphing by Table or Slope-Intercept Form
Linear equations can be graphed by making a t-table (table of values) or by rewriting the equation in slope-intercept form ().
Slope-intercept form:
Slope (m): The rate of change of y with respect to x
y-intercept (b): The value of y when x = 0
Graphing Lines Through the Origin
If a linear equation in standard form has a C value of 0, then the line will go through the origin.
Form: or
Midpoint Formula
Definition and Formula
The midpoint of a line segment is the point that is halfway between the endpoints. If the endpoints are and , the midpoint is:
Midpoint Formula:


Example: Finding the Midpoint
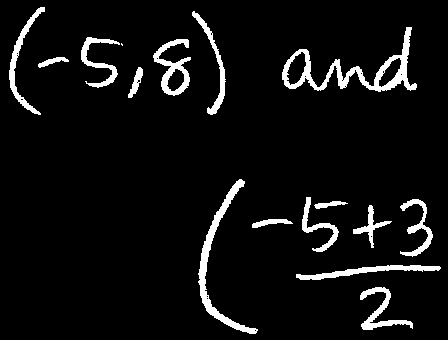
Find the coordinates of the midpoint of the line segment with endpoints and .
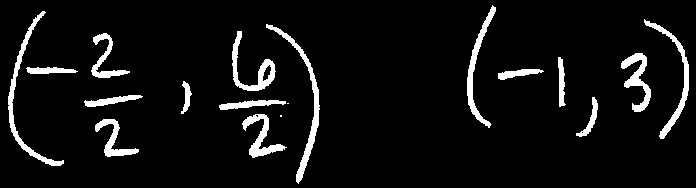
Step 1: Average the x-values:
Step 2: Average the y-values:
Midpoint:

Slope of a Line
Slope Formula
The slope of a line through two distinct points and is given by:
Slope Formula:
Interpretation: Slope is the "rise over run" or the change in y divided by the change in x.

Example: Calculating Slope
Find the slope of the line through the points and .
Step 1:
Interpretation: The slope is negative, indicating the line decreases as x increases.

Special Slope Cases
Undefined slope: Vertical lines ()
Zero slope: Horizontal lines ()

Summary Table: Types of Linear Equations
Equation Form | Graph Type | Slope |
|---|---|---|
Oblique line | m (finite) | |
Vertical line | Undefined | |
Horizontal line | 0 | |
Line through origin | Depends on A, B |
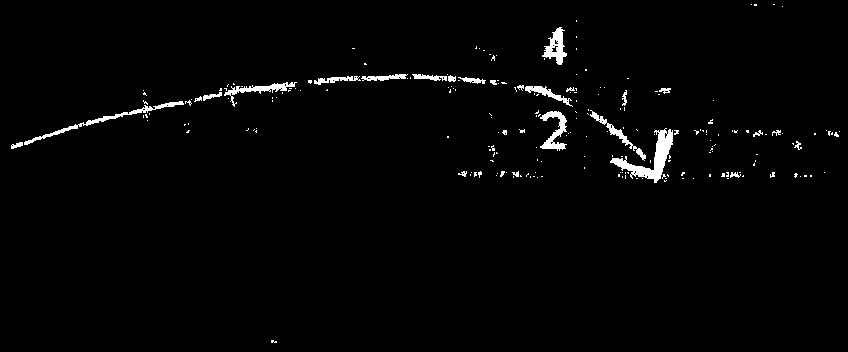
Additional info: The notes also include graphical representations and step-by-step calculations for intercepts, slope, and midpoint, reinforcing the algebraic concepts with visual aids.
