Join thousands of students who trust us to help them ace their exams!
Multiple Choice
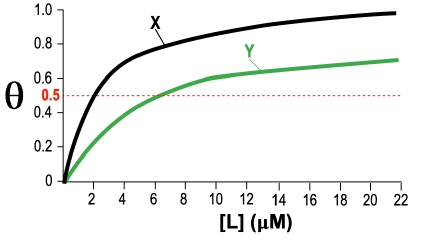
Consider the following graph for parts A-C. A) What is the protein-ligand dissociation constant (Kd) for protein X? a) 2 µM. b) 4 µM. c) 6 µM. d) 8 µM. B) What is the protein-ligand dissociation constant (Kd) for protein Y? a) 2 µM. b) 4 µM. c) 6 µM. d) 8 µM. C) Which protein has a greater affinity for ligand A? a) Protein X. b) Protein Y.
A
2 µM.
B
4 µM.
C
6 μM.
D
8 μM.
0 Comments
Verified step by step guidance
1
Identify the dissociation constant (Kd) from the graph, which is the ligand concentration at which the protein is 50% saturated. This corresponds to the point where the curve intersects the horizontal line at θ = 0.5.
For protein X, locate the point on the X-axis ([L]) where the black curve intersects the red dotted line at θ = 0.5. This concentration is the Kd for protein X.
For protein Y, locate the point on the X-axis ([L]) where the green curve intersects the red dotted line at θ = 0.5. This concentration is the Kd for protein Y.
Compare the Kd values for proteins X and Y. The protein with the lower Kd value has a greater affinity for the ligand, as it reaches 50% saturation at a lower ligand concentration.
Use the identified Kd values to answer the questions: A) Kd for protein X, B) Kd for protein Y, and C) which protein has a greater affinity for ligand A.


 Verified step by step guidance
