Join thousands of students who trust us to help them ace their exams!
Multiple Choice
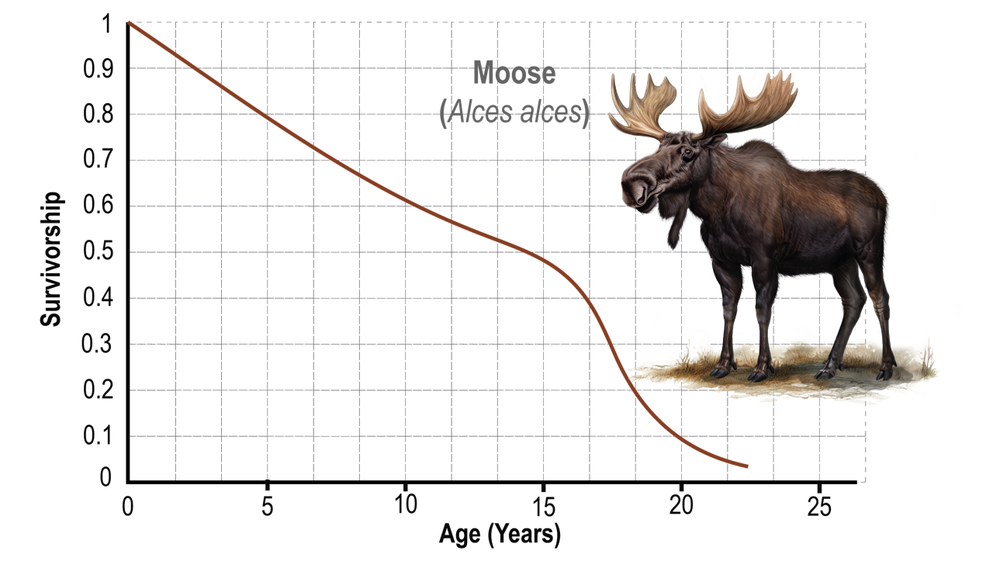
Based on the following survivorship curve for moose, how many moose in an initial cohort of 3,500 individuals would you expect to survive to age 20?
A
100 moose.
B
350 moose.
C
35 moose.
D
Impossible to tell.
0 Comments
Verified step by step guidance
1
Examine the survivorship curve provided in the image. The curve shows the proportion of the initial cohort of moose that survive to each age.
Identify the age of interest, which is 20 years, on the x-axis of the graph.
Trace a vertical line from age 20 on the x-axis up to the survivorship curve to determine the proportion of the initial cohort that survives to this age.
From the point where the vertical line intersects the curve, trace a horizontal line to the y-axis to read the survivorship value. This value represents the proportion of the initial cohort that survives to age 20.
Multiply the initial cohort size (3,500 moose) by the survivorship value obtained from the graph to calculate the expected number of moose surviving to age 20. Use the formula: \( \text{Number of survivors} = \text{Initial cohort size} \times \text{Survivorship at age 20} \).


 Verified step by step guidance
