Here are the essential concepts you must grasp in order to answer the question correctly.
Survivorship Curves
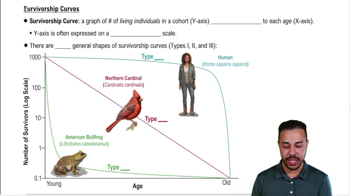
Survivorship curves are graphical representations that show the number of individuals in a population that survive to different ages. There are three types: Type I, where most individuals live to old age (e.g., humans); Type II, where the chance of survival is independent of age; and Type III, where most individuals die young, with few surviving to adulthood (e.g., many plants and fish).
Recommended video:
Type III Survivorship Curve
A Type III survivorship curve is characterized by high mortality rates for the young, with a few individuals surviving to adulthood. This pattern is common in species that produce a large number of offspring but provide little or no parental care, such as many plants, fish, and invertebrates. The strategy is to produce many offspring to ensure that at least some survive to reproduce.
Recommended video:
Life History Strategies
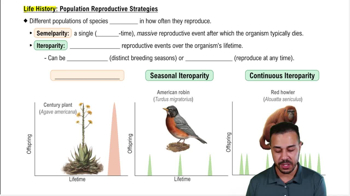
Life history strategies refer to the overall pattern in average timing and nature of life cycle events, shaped by natural selection to produce the largest possible number of surviving offspring. Species with a Type III survivorship curve often have an r-selected strategy, focusing on high reproductive rates, early maturity, and producing many offspring, which increases the chance of some surviving in unpredictable environments.
Recommended video:
Life History: Population Reproductive Strategies