Compare and contrast the lateral line system of fishes with electroreception in sharks.
Table of contents
- 1. Introduction to Biology2h 42m
- 2. Chemistry3h 37m
- 3. Water1h 26m
- 4. Biomolecules2h 23m
- 5. Cell Components2h 26m
- 6. The Membrane2h 31m
- 7. Energy and Metabolism2h 0m
- 8. Respiration2h 40m
- 9. Photosynthesis2h 49m
- 10. Cell Signaling59m
- 11. Cell Division2h 47m
- 12. Meiosis2h 0m
- 13. Mendelian Genetics4h 44m
- Introduction to Mendel's Experiments7m
- Genotype vs. Phenotype17m
- Punnett Squares13m
- Mendel's Experiments26m
- Mendel's Laws18m
- Monohybrid Crosses19m
- Test Crosses14m
- Dihybrid Crosses20m
- Punnett Square Probability26m
- Incomplete Dominance vs. Codominance20m
- Epistasis7m
- Non-Mendelian Genetics12m
- Pedigrees6m
- Autosomal Inheritance21m
- Sex-Linked Inheritance43m
- X-Inactivation9m
- 14. DNA Synthesis2h 27m
- 15. Gene Expression3h 6m
- 16. Regulation of Expression3h 31m
- Introduction to Regulation of Gene Expression13m
- Prokaryotic Gene Regulation via Operons27m
- The Lac Operon21m
- Glucose's Impact on Lac Operon25m
- The Trp Operon20m
- Review of the Lac Operon & Trp Operon11m
- Introduction to Eukaryotic Gene Regulation9m
- Eukaryotic Chromatin Modifications16m
- Eukaryotic Transcriptional Control22m
- Eukaryotic Post-Transcriptional Regulation28m
- Eukaryotic Post-Translational Regulation13m
- 17. Viruses37m
- 18. Biotechnology2h 58m
- 19. Genomics17m
- 20. Development1h 5m
- 21. Evolution3h 1m
- 22. Evolution of Populations3h 53m
- 23. Speciation1h 37m
- 24. History of Life on Earth2h 6m
- 25. Phylogeny2h 31m
- 26. Prokaryotes4h 59m
- 27. Protists1h 12m
- 28. Plants1h 22m
- 29. Fungi36m
- 30. Overview of Animals34m
- 31. Invertebrates1h 2m
- 32. Vertebrates50m
- 33. Plant Anatomy1h 3m
- 34. Vascular Plant Transport1h 2m
- 35. Soil37m
- 36. Plant Reproduction47m
- 37. Plant Sensation and Response1h 9m
- 38. Animal Form and Function1h 19m
- 39. Digestive System1h 10m
- 40. Circulatory System1h 49m
- 41. Immune System1h 12m
- 42. Osmoregulation and Excretion50m
- 43. Endocrine System1h 4m
- 44. Animal Reproduction1h 2m
- 45. Nervous System1h 55m
- 46. Sensory Systems46m
- 47. Muscle Systems23m
- 48. Ecology3h 11m
- Introduction to Ecology20m
- Biogeography14m
- Earth's Climate Patterns50m
- Introduction to Terrestrial Biomes10m
- Terrestrial Biomes: Near Equator13m
- Terrestrial Biomes: Temperate Regions10m
- Terrestrial Biomes: Northern Regions15m
- Introduction to Aquatic Biomes27m
- Freshwater Aquatic Biomes14m
- Marine Aquatic Biomes13m
- 49. Animal Behavior28m
- 50. Population Ecology3h 41m
- Introduction to Population Ecology28m
- Population Sampling Methods23m
- Life History12m
- Population Demography17m
- Factors Limiting Population Growth14m
- Introduction to Population Growth Models22m
- Linear Population Growth6m
- Exponential Population Growth29m
- Logistic Population Growth32m
- r/K Selection10m
- The Human Population22m
- 51. Community Ecology2h 46m
- Introduction to Community Ecology2m
- Introduction to Community Interactions9m
- Community Interactions: Competition (-/-)38m
- Community Interactions: Exploitation (+/-)23m
- Community Interactions: Mutualism (+/+) & Commensalism (+/0)9m
- Community Structure35m
- Community Dynamics26m
- Geographic Impact on Communities21m
- 52. Ecosystems2h 36m
- 53. Conservation Biology24m
46. Sensory Systems
Sensory System
Problem 9
Textbook Question
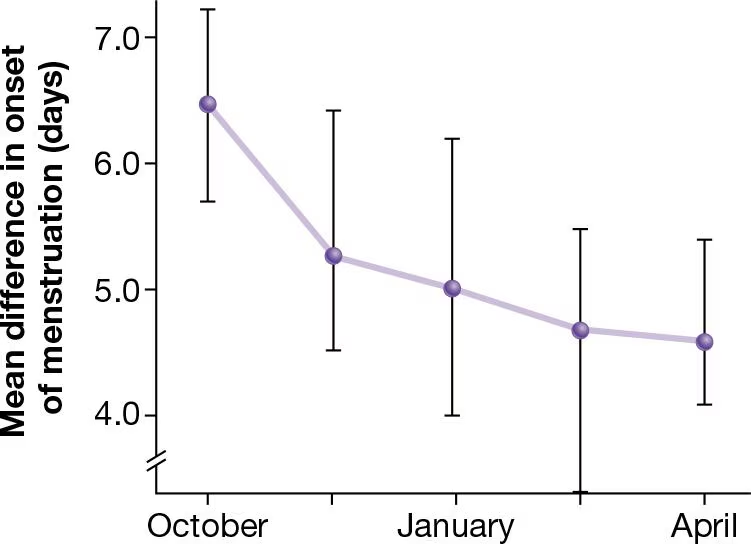
Scientists collected data on the date of onset of the menstrual cycles in a group of women who moved into a college dormitory together in the fall. The y-axis of the graph shows the mean difference (in days) between the onset of a woman's cycle and the average onset date of the rest of the women. Evaluate whether these data provide evidence for the existence of a human pheromone.


1
Examine the graph provided, which shows the mean difference in onset of menstruation (in days) on the y-axis, and the months (October, January, April) on the x-axis.
Observe the trend in the graph: the mean difference in onset of menstruation decreases over time from October to April.
Consider the concept of menstrual synchrony, which suggests that women living together may experience synchronized menstrual cycles due to pheromones.
Evaluate the decrease in mean difference as potential evidence for menstrual synchrony, as the cycles appear to become more aligned over time.
Assess the error bars in the graph, which indicate variability in the data. Consider whether the overlap of error bars suggests significant or insignificant changes in cycle synchronization.

This video solution was recommended by our tutors as helpful for the problem above
Video duration:
2mPlay a video:
Was this helpful?
Key Concepts
Here are the essential concepts you must grasp in order to answer the question correctly.
Human Pheromones
Pheromones are chemical signals released by an individual that can affect the behavior or physiology of others of the same species. In humans, the existence and effects of pheromones are debated, particularly regarding their role in synchronizing menstrual cycles among women. Understanding pheromones is crucial for evaluating whether the observed data supports their existence.
Recommended video:
Guided course
The Human Population
Menstrual Cycle Synchrony
Menstrual cycle synchrony refers to the phenomenon where women living in close proximity may experience synchronized menstrual cycles. This concept is often linked to the potential influence of pheromones. Analyzing data on cycle onset can help determine if there is a statistically significant pattern that supports this idea.
Recommended video:
Guided course
Menstrual Cycle
Statistical Analysis of Data
Statistical analysis involves using mathematical techniques to interpret data and draw conclusions. In this context, evaluating the mean differences in menstrual cycle onset and their significance over time is essential to determine if the observed patterns are statistically valid and indicative of pheromonal influence.
Recommended video:
Guided course
Population Demography
Related Videos
Related Practice
Textbook Question
967
views