 Back
BackCellular Respiration and Fermentation: Mechanisms and Pathways
Study Guide - Smart Notes
 Tailored notes based on your materials, expanded with key definitions, examples, and context.
Cellular Respiration & Fermentation
Overview: Life is Work
Living cells require energy to perform essential functions. This energy is obtained from external sources, primarily through the consumption of organic molecules. Animals acquire energy by eating other animals or feeding on photosynthetic organisms such as plants and algae.
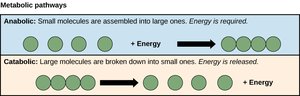
Catabolic Pathways Yield Energy by Oxidizing Organic Fuel
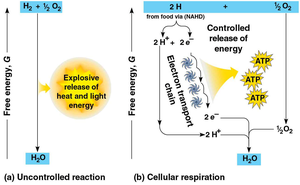
Catabolic pathways break down complex molecules into simpler ones, releasing energy stored in covalent bonds. This energy is used to generate ATP, the cell’s energy currency, and is also lost as heat.
Aerobic respiration: Complete catabolism of organic molecules, consumes O2, generates CO2, H2O, and ATP.
Anaerobic respiration: Partial catabolism, uses molecules other than O2 (e.g., sulfur, nitrogen), generates CO2 and ATP.
Fermentation: Partial catabolism without O2, generates little ATP and waste products.
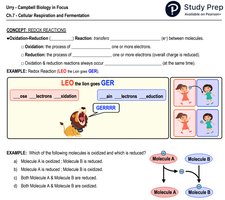
Redox Reactions (OIL RIG)
Redox reactions transfer electrons between reactants, releasing energy for ATP synthesis.
Oxidation: Loss of electrons, increase in charge, molecule becomes less energized.
Reduction: Gain of electrons, decrease in charge, molecule becomes more energized.
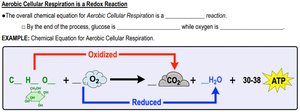
Oxidation of Organic Fuel Molecules During Cellular Respiration
During cellular respiration, fuel molecules like glucose are oxidized, and O2 is reduced. Glucose is highly reduced and contains many hydrogen atoms, which act as reducing agents. As hydrogen is transferred to oxygen, energy is released for ATP synthesis.
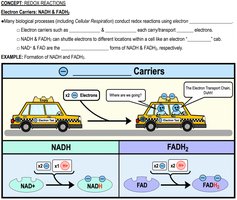
Electron Carriers: NAD+ and FAD
Electrons from organic compounds are transferred to electron carriers such as NAD+ and FAD. These carriers shuttle electrons between reactions, facilitating energy transfer.
NAD+: Electron acceptor, forms NADH (reduced form).
NADH: Stores potential energy, used to synthesize ATP.
FAD: Another electron carrier, forms FADH2 when reduced.
Stages of Cellular Respiration
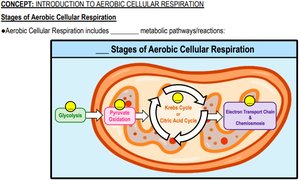
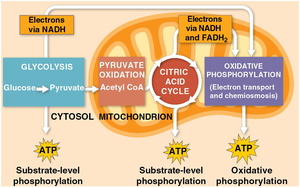
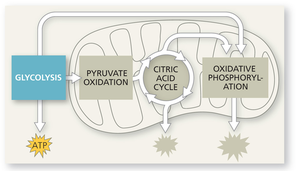
Cellular respiration consists of three main stages:
Glycolysis: Breaks down glucose into two pyruvate molecules in the cytosol.
Pyruvate Oxidation and Citric Acid Cycle: Completes glucose breakdown in mitochondria (eukaryotes) or cytoplasmic membrane (prokaryotes).
Oxidative Phosphorylation: Produces most ATP via electron transport chain and chemiosmosis.
ATP Production: Substrate-Level vs. Oxidative Phosphorylation
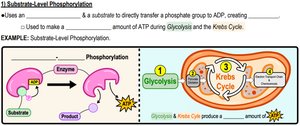
Substrate-level phosphorylation: Direct transfer of phosphate group to ADP using an enzyme, occurs in glycolysis and citric acid cycle.
Oxidative phosphorylation: Uses electron transport chain and proton gradient to generate ATP, occurs in mitochondria.
Glycolysis: Harvesting Chemical Energy
Glycolysis - “Sugar-Splitting”
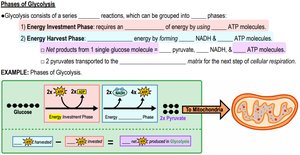
Glycolysis is the first step in both aerobic respiration and fermentation. It splits a 6-carbon glucose molecule into two 3-carbon pyruvate molecules. Glycolysis does not require oxygen and occurs in the cytoplasm.
Input: 1 glucose, 2 ATP
Output: 4 ATP (gross), 2 NADH, 2 pyruvate, H2O
Net ATP: 2 ATP
Pyruvate Oxidation and Citric Acid Cycle
Pyruvate Oxidation
If O2 is present, pyruvate enters the mitochondrion and is converted to acetyl CoA, linking glycolysis to the citric acid cycle. This step generates CO2 and NADH.
Input: Pyruvic acid
Output: Acetyl-CoA, CO2, NADH
Citric Acid Cycle
The citric acid cycle completes the breakdown of glucose, occurring twice for each glucose molecule. It produces ATP, CO2, NADH, and FADH2.
Input: 2 acetyl CoA
Output: 2 ATP, CO2, NADH, FADH2
Oxidative Phosphorylation and Chemiosmosis
Electron Transport Chain (ETC)
The ETC is a series of molecules embedded in the inner mitochondrial membrane. NADH and FADH2 donate electrons, which are transferred to O2, generating a proton gradient and producing >30 ATP.
Chemiosmosis
ATP synthase uses the energy from the proton gradient to phosphorylate ADP, producing ATP. This process is called chemiosmosis.
Fermentation and Anaerobic Respiration
Fermentation
Fermentation allows cells to produce ATP without oxygen. It does not use the ETC and only partially catabolizes glucose, yielding 2 ATP per glucose.
Alcohol fermentation: Pyruvate is converted to ethanol, CO2 is released, NAD+ is regenerated.
Lactic acid fermentation: Pyruvate is reduced to lactic acid, NAD+ is regenerated, occurs in muscle cells and some bacteria.
Anaerobic Respiration
Anaerobic respiration uses an ETC with molecules other than O2 as the final electron acceptor. It is performed by certain bacteria, archaea, and yeast.
Comparing Fermentation, Anaerobic, and Aerobic Respiration
Process | Final Electron Acceptor | ATP Yield |
|---|---|---|
Aerobic Respiration | O2 | >30 ATP |
Anaerobic Respiration | Other molecules (e.g., sulfur, nitrogen) | 2->30 ATP |
Fermentation | None (uses pyruvate) | 2 ATP |
Connections to Other Metabolic Pathways
Catabolism of Carbohydrates, Proteins, and Fats
Glycolysis and the citric acid cycle are central to many metabolic pathways. Carbohydrates, proteins, and fats can all be catabolized to enter these pathways.
Carbohydrates: Hydrolyzed to glucose, enter glycolysis.
Proteins: Digested to amino acids, deaminated, enter glycolysis or citric acid cycle.
Fats: Glycerol enters glycolysis; fatty acids enter citric acid cycle via beta-oxidation.
Biosynthesis (Anabolic Pathways)
Anabolic pathways build molecules such as proteins, glycogen, and fats, consuming ATP. Intermediate molecules from glycolysis and the citric acid cycle can be diverted to anabolic pathways for biosynthesis.
Summary of Cellular Respiration
Cellular respiration transfers ~34% of glucose’s potential energy to ATP.
Remaining energy is lost as heat.
Food provides fuel for ATP production and building blocks for biosynthesis.
