 Back
Back8.1 Species Abundance, Diversity, and Biodiversity in Ecological Communities
Study Guide - Smart Notes
 Tailored notes based on your materials, expanded with key definitions, examples, and context.
Biodiversity: Concepts and Measurement
Definition and Scope of Biodiversity
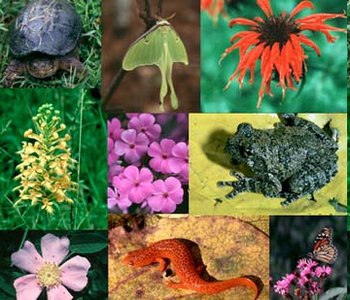
Biodiversity refers to the variety of life forms at multiple levels of biological organization, including genes, species, and communities. It is a central concept in ecology, reflecting the complexity and interconnectedness of life on Earth.
Genetic diversity: Variation in genes within a species.
Species diversity: Variety and abundance of different species within a community.
Community/ecosystem diversity: Diversity of ecological communities and their interactions.
Key Questions:
How do we measure biodiversity?
What are the patterns of biodiversity?
What are the consequences of biodiversity?
Global Patterns of Biodiversity
Species Richness on Earth
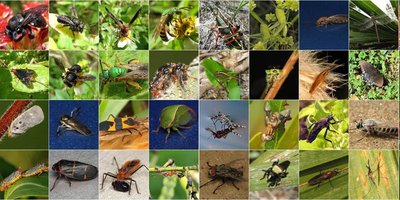
Scientists have described about 2 million species, but estimates suggest there may be 5–30 million species globally. Among multicellular organisms:
~4% are vertebrates
~75% are invertebrates
~18% are plants
~3% are other groups
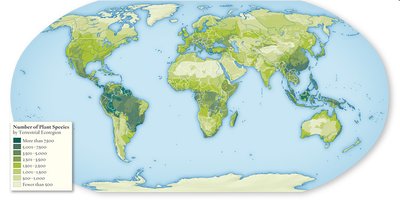
Species richness and composition vary by latitude, with lower latitudes (closer to the equator) generally supporting more species and greater variation in community composition.
Measuring Biodiversity in Communities
Sampling and Estimation
To estimate the number of species in a community, ecologists must consider:
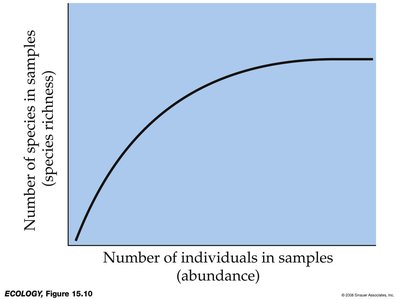
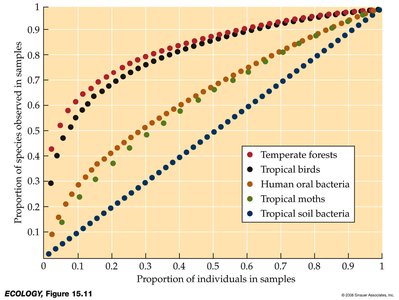
Sampling effort: How much should we sample? Sampling continues until the number of new species observed plateaus, indicating most species have been detected.
Indicator taxa: Sampling an easy-to-find group can provide insights into overall diversity.
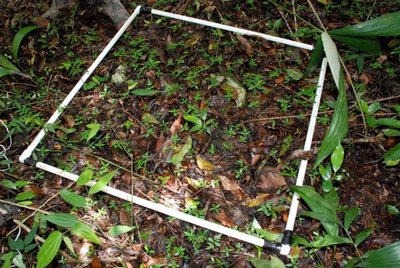
Standardized sampling: Using consistent plot sizes and methods allows for comparison between locations and determination of relative abundance.
Measures of Community Structure
Quantitative Descriptions
Community structure is described using three main measures:
Species richness (S): The number of species present in a community.
Species evenness: The relative abundance of each species, indicating how common or rare species are within the community.
Species diversity: A combined measure of richness and evenness, often calculated using diversity indices.
Species Richness
Species richness is simply the count of species in a given area (S).
Species Evenness
Evenness provides information on the distribution of individuals among species. Communities with similar richness can differ in evenness, affecting overall diversity.
Species Diversity Indices
The most common index is the Shannon Index (H'), which incorporates both richness and evenness:
pi: Proportion of the i-th species
s: Total number of species
Higher H' values indicate greater diversity
Example Calculation:
Community A:
Community B:
Scientists use diversity indices to compare communities, but similar index values can result from different combinations of richness and evenness.
Rank-Abundance Curves
Rank-abundance curves graphically represent species richness (length of the curve) and evenness (slope of the curve). Flatter slopes indicate higher evenness.
Environmental Complexity and Diversity
Role of Environmental Complexity
More complex environments (e.g., greater vegetation structure, elevation changes, nutrient availability) support higher species diversity. Complexity provides more niches and resources, reducing competition and allowing more species to coexist.
Example: MacArthur’s warblers showed that higher foliage height diversity in forests led to greater bird species diversity.
Consequences of Biodiversity
Stability and Resilience
Diverse communities are generally more stable (maintain structure and function over time) and more resilient (recover quickly after disturbances).
Stability: Tendency of a community to remain unchanged.
Resilience: Rate of recovery after disturbance.
Community Functions
Greater biodiversity enhances community functions such as:
Nutrient cycling
Carbon sequestration
Water and air purification
Waste decomposition
Pollination
Hypotheses of the Diversity-Function Relationship
Complementarity hypothesis: Community function increases linearly with species richness.
Redundancy hypothesis: There is an upper limit to the effect of richness; additional species become redundant.
Driver and passenger hypothesis: Some species (drivers) have a large effect on function, while others (passengers) have little effect.
Driver and passenger with overlap: Some species may overlap in their functional roles.
Conservation Biology Preview
Understanding how to preserve biodiversity is a central goal of conservation biology, which seeks to maintain the diversity and function of ecological communities for future generations.
