 Back
BackBusiness Calculus Exam Practice: Limits, Continuity, and Derivatives
Study Guide - Smart Notes
 Tailored notes based on your materials, expanded with key definitions, examples, and context.
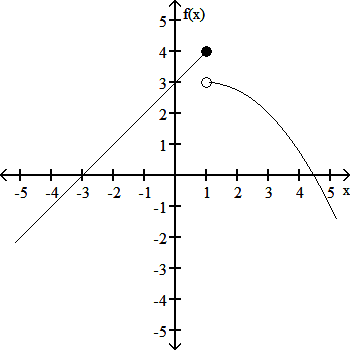
Q1. Does the limit exist? If so, what is its value?
Background
Topic: Limits and Continuity
This question tests your understanding of one-sided limits and how to interpret them from a graph. You need to determine if the function approaches a specific value as approaches 1 from the right.
Key Terms and Formulas:
One-sided limit: means the value approaches as gets closer to from the right (values greater than $a$).
Continuity: A function is continuous at if .
Step-by-Step Guidance
Examine the graph at and focus on the behavior as approaches 1 from the right (values just greater than 1).
Identify the value that is approaching as gets closer to 1 from the right. Look for the curve or point on the graph that represents this approach.
Check if there is a jump, hole, or discontinuity at that might affect the limit.
Compare the value the function approaches from the right to any marked points or open circles at .
Try solving on your own before revealing the answer!
Final Answer: The limit exists and is 3.
As approaches 1 from the right, the function approaches the value at the open circle, which is 3.
The filled circle at represents , but the limit from the right is determined by the curve approaching the open circle.
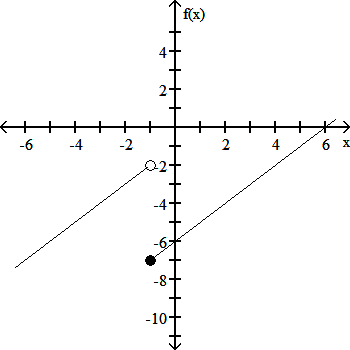
Q2. Find and from the graph.
Background
Topic: One-Sided Limits and Discontinuity
This question asks you to find the left-hand and right-hand limits at using the graph. It tests your ability to read limits from a graph and recognize discontinuities.
Key Terms and Formulas:
Left-hand limit: is the value approaches as comes from values less than .
Right-hand limit: is the value approaches as comes from values greater than .
Discontinuity: Occurs if the left and right limits are not equal or if the function jumps.
Step-by-Step Guidance
Look at the graph near and observe the behavior as approaches from the left (values less than $-1$).
Identify the value the function approaches from the left. This is the left-hand limit.
Now, observe the behavior as approaches from the right (values greater than $-1$).
Identify the value the function approaches from the right. This is the right-hand limit.
Check if the left and right limits are equal or if there is a jump/discontinuity at .
Try solving on your own before revealing the answer!
Final Answer: ,
The left-hand limit is the value the function approaches from the left, and the right-hand limit is the value it approaches from the right. The jump in the graph at indicates a discontinuity.
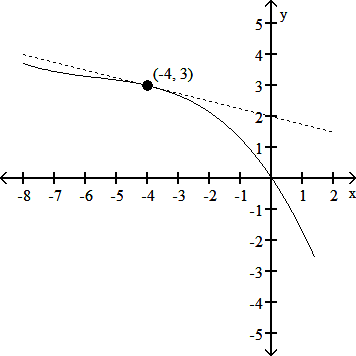
Q6. Estimate the slope of the tangent line to the curve at the given point .
Background
Topic: Tangent Lines and Derivatives
This question tests your ability to estimate the slope of a tangent line to a curve at a specific point using a graph. The slope of the tangent line represents the instantaneous rate of change at that point.
Key Terms and Formulas:
Tangent line: A line that touches the curve at one point and has the same slope as the curve at that point.
Slope: , the change in divided by the change in .
Derivative: gives the slope of the tangent line at .
Step-by-Step Guidance
Identify the tangent line drawn at the point on the graph.
Choose two points on the tangent line (not necessarily on the curve) to estimate the slope.
Calculate the change in () and the change in () between these two points.
Use the formula to estimate the slope.
Try solving on your own before revealing the answer!
Final Answer: The estimated slope is .
By picking two points on the tangent line and calculating the ratio of vertical to horizontal change, you find the slope.
