 Back
BackBusiness Calculus Study Guide: Marginal Analysis, Derivatives, and Graphs
Study Guide - Smart Notes
 Tailored notes based on your materials, expanded with key definitions, examples, and context.
Marginal Analysis in Business and Economics
Revenue, Cost, and Profit Functions
In business calculus, understanding how revenue, cost, and profit functions relate to production is essential. These functions help analyze the financial outcomes of manufacturing and selling products.
Revenue Function (R(x)): Represents the total income from selling x items at price p.
Cost Function (C(x)): Represents the total cost incurred in producing x items, including fixed and variable costs.
Profit Function (P(x)): Represents the net gain from production and sales.
Example: If and , then .
Marginal Functions
Marginal functions measure the instantaneous rate of change of revenue, cost, or profit with respect to production. These are derivatives of the respective functions.
Marginal Revenue (R'(x)): is the derivative of revenue with respect to x.
Marginal Cost (C'(x)): is the derivative of cost with respect to x.
Marginal Profit (P'(x)): is the derivative of profit with respect to x.
Interpretation: Marginal values estimate the change in revenue, cost, or profit for producing one additional unit.
Average and Marginal Average Functions
Average functions provide per-unit values, while marginal average functions are their derivatives.
Average Revenue:
Average Cost:
Average Profit:
Marginal Average Cost:
Marginal Average Profit:
Marginal Average Revenue:
Marginal vs. Exact Change
The derivative at a point provides an approximation for the change in function value for a small increase in x. For example, the marginal cost at x = a approximates the exact cost of producing the (a+1)th item:
Continuously Compounded Interest
Compound Interest Formula
Continuous compounding is used to calculate the future value of an investment:
Formula:
P: Principal (initial amount)
r: Annual interest rate (decimal)
t: Time in years
Example: If , , , then
Product Rule and Quotient Rule
Product Rule
The product rule is used to differentiate the product of two functions:
Formula:
Example:
Quotient Rule
The quotient rule is used to differentiate the quotient of two functions:
Formula:
Example:
The Chain Rule
Chain Rule for Derivatives
The chain rule is used to differentiate composite functions:
Formula:
Example: If , then
Elasticity of Demand
Elasticity Formula and Classification
Elasticity measures the responsiveness of demand to price changes:
Formula:
Elastic: (price increase decreases revenue)
Inelastic: (price increase increases revenue)
Unit Elastic: (price change has no effect on revenue)
First Derivative and Graphs
Increasing, Decreasing, and Extrema
The first derivative provides information about the behavior of a function:
Increasing:
Decreasing:
Local Maximum: changes from positive to negative
Local Minimum: changes from negative to positive
Critical Points: Where or is undefined
Example: Analyzing a Graph
The graph below illustrates the concepts of increasing/decreasing intervals, critical points, and local extrema for a function .
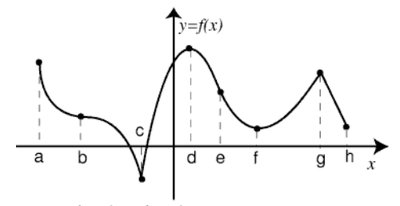
Increasing Intervals: Where the graph rises as x increases.
Decreasing Intervals: Where the graph falls as x increases.
Critical Points: Points where the slope is zero or undefined (e.g., at b, c, d, f, g).
Local Minima: Lowest points in a neighborhood (e.g., at b, f).
Local Maxima: Highest points in a neighborhood (e.g., at d, g).
Second Derivatives and Graphs
Concavity and Inflection Points
The second derivative describes the concavity of a function and helps identify inflection points:
Concave Up: (graph bends upwards)
Concave Down: (graph bends downwards)
Inflection Point: Where changes sign and is continuous
Example: Concavity and Inflection Points
The graph below shows regions of concavity and inflection points for a function .
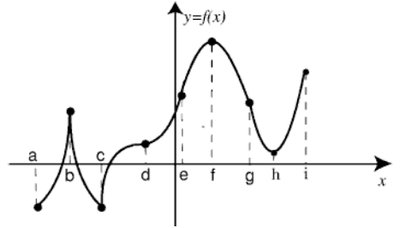
Concave Up: Intervals where the graph is shaped like a cup.
Concave Down: Intervals where the graph is shaped like a cap.
Inflection Points: Points where the graph changes from concave up to concave down or vice versa (e.g., at c, f).
Finding Inflection Points
Find where or does not exist.
Check if is continuous at those points.
Determine if changes sign at those points.
