 Back
BackMarginal Analysis in Business and Economics: Limits and the Derivative
Study Guide - Smart Notes
 Tailored notes based on your materials, expanded with key definitions, examples, and context.
Marginal Analysis in Business and Economics
Introduction to Marginal Analysis
Marginal analysis is a fundamental application of calculus in business and economics, focusing on how small changes in production levels affect cost, revenue, and profit. This section explores the use of derivatives to analyze these changes and make informed business decisions.
Definitions: Marginal Cost, Revenue, and Profit
Total Cost (C(x)): The total expense incurred in producing x units of a product.
Marginal Cost (C'(x)): The derivative of the total cost function, representing the instantaneous rate of change of cost with respect to production level.
Total Revenue (R(x)): The total income from selling x units.
Marginal Revenue (R'(x)): The derivative of the total revenue function, indicating the rate of change of revenue per additional unit sold.
Total Profit (P(x)): The difference between total revenue and total cost, P(x) = R(x) - C(x).
Marginal Profit (P'(x)): The derivative of the profit function, or P'(x) = R'(x) - C'(x).
Marginals and Derivatives
Marginal cost, revenue, and profit are interpreted as the instantaneous rates of change of their respective total functions. In practical terms, they estimate the cost, revenue, or profit associated with producing one additional unit at a given production level.
Marginal Cost and Exact Cost
The exact additional cost of producing one more item is given by the difference C(x+1) - C(x). This concept also applies to revenue and profit:
Additional revenue: R(x+1) - R(x)
Additional profit: P(x+1) - P(x)
Relationship Between Marginal and Exact Cost
The marginal cost function provides an approximation to the exact cost of producing the next item:
C'(x) \approx C(x+1) - C(x)
This approximation improves as the production level increases and the cost function is smooth.
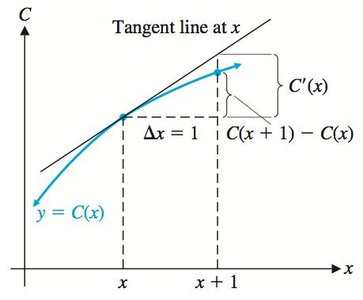
Theorem: Marginal Cost Approximates Exact Cost
If C(x) is the total cost of producing x items, then the marginal cost at x approximates the exact cost of producing the (x+1)st item:
Similar statements hold for revenue and profit functions.
Example: Cost Analysis
Suppose a company manufactures fuel tanks, and the total weekly cost is given by:
Marginal Cost Function:
Marginal Cost at 500 Units:
Interpretation: At 500 units, the cost is increasing at $40 per tank; the 501st tank should cost about $40.
Exact Cost of 501st Tank:
Example: Comparing Marginal and Exact Cost
Given :
Exact cost of 121st bicycle:
Marginal cost at : , so
The marginal cost is a good approximation to the exact cost.
Example: Production Strategy and Price-Demand Equation
Suppose the price-demand equation is , or .
Domain: (both price and demand must be nonnegative)
Cost, Revenue, and Profit Functions
Cost Function: (fixed cost , variable cost $2$ per unit)
Marginal Cost: (constant; each additional unit costs $2$)
Revenue Function:
Domain:
Marginal Revenue and Interpretation
Marginal Revenue:
At : (revenue increases with more production)
At : (revenue does not change with more production)
At : (revenue decreases with more production)
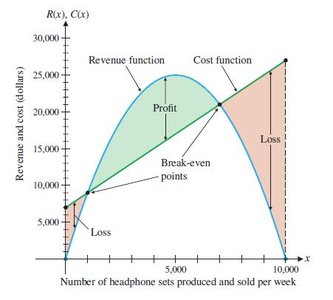
Graphical Analysis: Cost, Revenue, and Profit
The intersection points of the cost and revenue functions represent break-even points. Profit is positive between these points and negative outside them.
Profit Function and Marginal Profit
Profit Function:
Domain:
Marginal Profit:
At : (profit increases with more production)
At : (profit does not change with more production)
At : (profit decreases with more production)
Marginal Average Cost, Revenue, and Profit
Average Cost:
Marginal Average Cost:
Average Revenue:
Marginal Average Revenue:
Average Profit:
Marginal Average Profit:
Example: Average and Marginal Average Cost
Given :
Average cost for 1,000 units:
Marginal average cost at 1,000 units: , so at ,
Interpretation: Each additional dictionary reduces the per unit cost by about 2 cents at this production level.
Estimated average cost for 1,001 units:
Cautions and Interpretation
The marginal average cost function is found by first computing the average cost, then differentiating. Reversing the order yields a different, non-useful function.
Marginal cost has two interpretations: as the instantaneous rate of change and as an approximation to the exact cost of the next item. This does not apply to marginal average cost.
Similar remarks apply to revenue and profit functions.
