Join thousands of students who trust us to help them ace their exams!
Multiple Choice
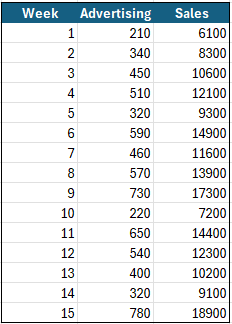
A small business tracks how advertising spending relates to weekly sales. Plot Advertising Spending (x) vs Sales (y) & find the regression line & correlation coefficient.
A
;
B
;
C
;
D
;
0 Comments
Verified step by step guidance
1
Step 1: Organize the data by listing the advertising spending (x) and corresponding sales (y) for each week as given in the table.
Step 2: Calculate the means of the advertising spending (\(\bar{x}\)) and sales (\(\bar{y}\)) using the formulas \(\bar{x} = \frac{\sum x_i}{n}\) and \(\bar{y} = \frac{\sum y_i}{n}\), where \(n\) is the number of data points.
Step 3: Compute the slope (\(b\)) of the regression line using the formula \(b = \frac{\sum (x_i - \bar{x})(y_i - \bar{y})}{\sum (x_i - \bar{x})^2}\).
Step 4: Calculate the intercept (\(a\)) of the regression line using \(a = \bar{y} - b \bar{x}\).
Step 5: Form the regression equation as \(y = bx + a\). Then, calculate the correlation coefficient (\(r\)) using \(r = \frac{\sum (x_i - \bar{x})(y_i - \bar{y})}{\sqrt{\sum (x_i - \bar{x})^2 \sum (y_i - \bar{y})^2}}\) to measure the strength and direction of the linear relationship.


 Verified step by step guidance
