- Download the worksheet to save time writing
- Start solving the practice problems
- If you're stuck, watch the video solutions
- See your summary to get more insights

A researcher claims that the distribution of adult heights in a population is normally distributed. To test this claim, a sample of adults is taken, and their heights (in inches) are grouped into the following class intervals:
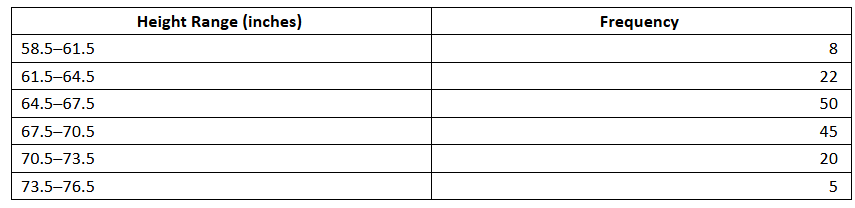
Use to test the claim that the heights are normally distributed if .
A health researcher claims that the distribution of gym attendance across the week is as follows:
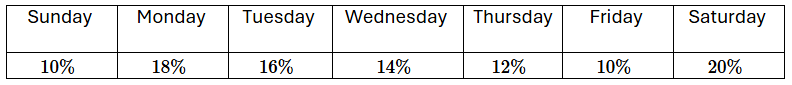
You randomly survey gym members and ask which day of the week they most often go to the gym. The results are:
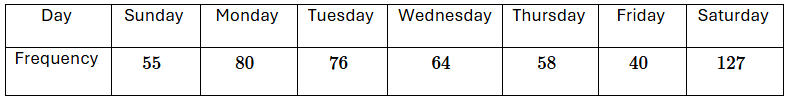
At , test the researcher’s claim.
A hospital administrator claims that emergency room (ER) visits occur equally across all days of the week. To test this, a random sample of ER visits from the past month is analyzed. The number of visits per day is recorded below:
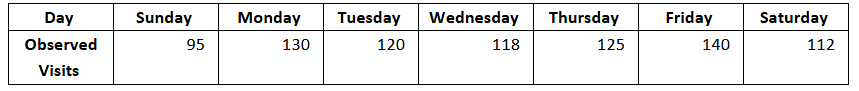
Test the administrator’s claim at the significance level.
A wildlife biologist recorded the number of sightings of a bird species at different elevation ranges. The data is:
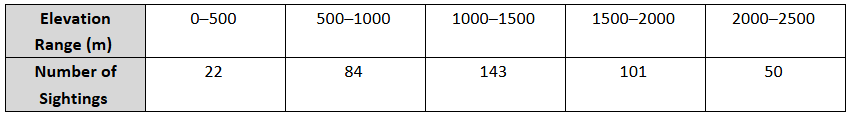
Test the claim that the distribution of sightings is normally distributed using a chi-square goodness-of-fit test at the significance level.
A researcher claims that the distribution of people’s preferred grocery shopping methods has changed from a past survey. According to the past survey, the distribution was:
In-store shopping:
Online pickup:
Home delivery:
Subscription service:
To test this claim, a sample of people was surveyed with the following results:
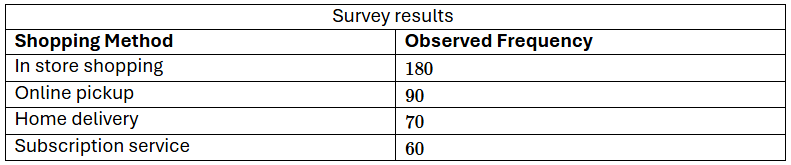
Decide whether to reject or fail to reject the null hypothesis if .
The following contingency table summarizes data for adults ages and over by education and employment status:
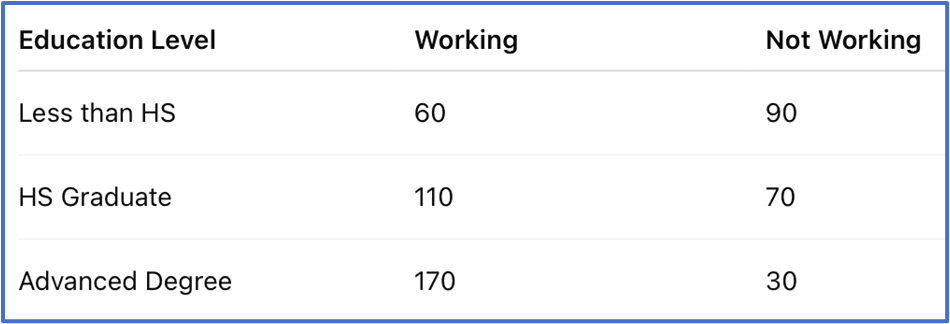
What percentage of these adults with an advanced degree are not working?
A hospital records the last digits of newborns' birth weights in grams. The frequencies for digits through are shown below:

What is the chi-square test statistic to determine whether the last digits are uniformly distributed?