13. Chi-Square Tests & Goodness of Fit / Goodness of Fit Test / Problem 6
Problem 6
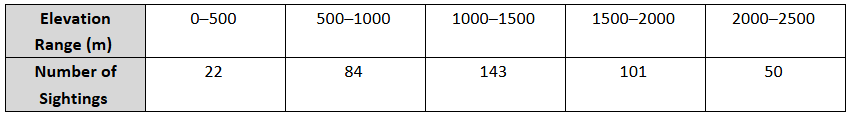
A wildlife biologist recorded the number of sightings of a bird species at different elevation ranges. The data is: Test the claim that the distribution of sightings is normally distributed using a chi-square goodness-of-fit test at the significance level.