Skip to main content
Statistics for Business
My Course
Learn
Exam Prep
AI Tutor
Study Guides
Flashcards
Explore
Try the app
My Course
Learn
Exam Prep
AI Tutor
Study Guides
Flashcards
Explore
Try the app
Back
3. Describing Data Numerically
Download worksheet
Problem 1
Problem 2
Problem 3
Problem 4
Problem 5
Problem 6
Problem 7
Problem 8
Problem 9
Problem 10
Problem 11
Problem 12
Problem 13
Problem 14
Problem 15
3. Describing Data Numerically
Download worksheet
Practice
Summary
Previous
11 of 15
Next
3. Describing Data Numerically / Standard Deviation / Problem 11
Problem 11
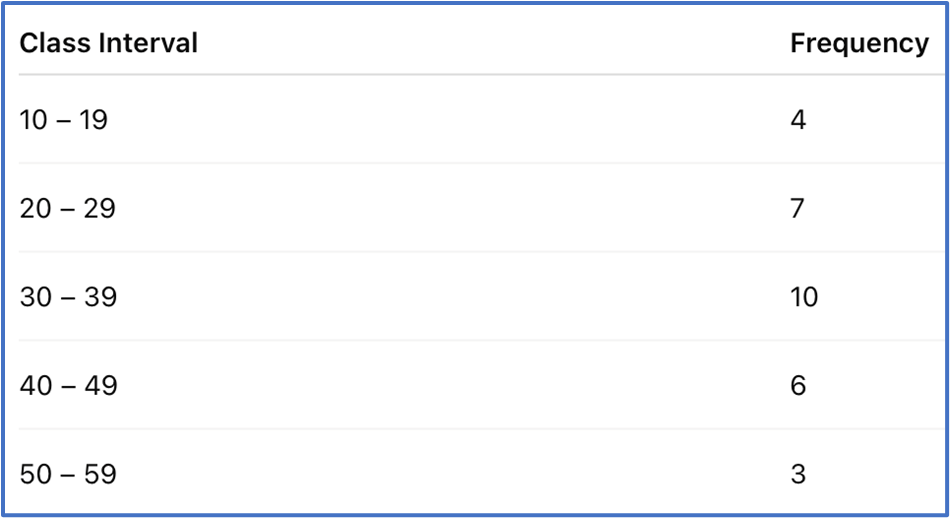
Using the class midpoints and corresponding frequencies, estimate the sample mean and standard deviation of the provided data.
A
x
ˉ
=
33.5
\(\bar{x}\)=33.5
s
=
13.2
s=13.2
B
x
ˉ
=
38.0
\(\bar{x}\)=38.0
s
=
11.9
s=11.9
C
x
ˉ
=
33.5
\(\bar{x}\)=33.5
s
=
11.9
s=11.9
D
x
ˉ
=
38.0
\(\bar{x}\)=38.0
s
=
13.2
s=13.2
AI tutor
0
0 Comments
Show Answer
More options