Skip to main content
Statistics for Business
My Course
Learn
Exam Prep
AI Tutor
Study Guides
Flashcards
Explore
Try the app
My Course
Learn
Exam Prep
AI Tutor
Study Guides
Flashcards
Explore
Try the app
Back
6. Normal Distribution & Continuous Random Variables
Download worksheet
Problem 1
Problem 2
Problem 3
Problem 4
Problem 5
Problem 6
Problem 7
Problem 8
Problem 9
Problem 10
Problem 11
Problem 12
Problem 13
Problem 14
Problem 15
6. Normal Distribution & Continuous Random Variables
Download worksheet
Practice
Summary
Previous
7 of 15
Next
6. Normal Distribution & Continuous Random Variables / Probabilities & Z-Scores w/ Graphing Calculator / Problem 7
Problem 7
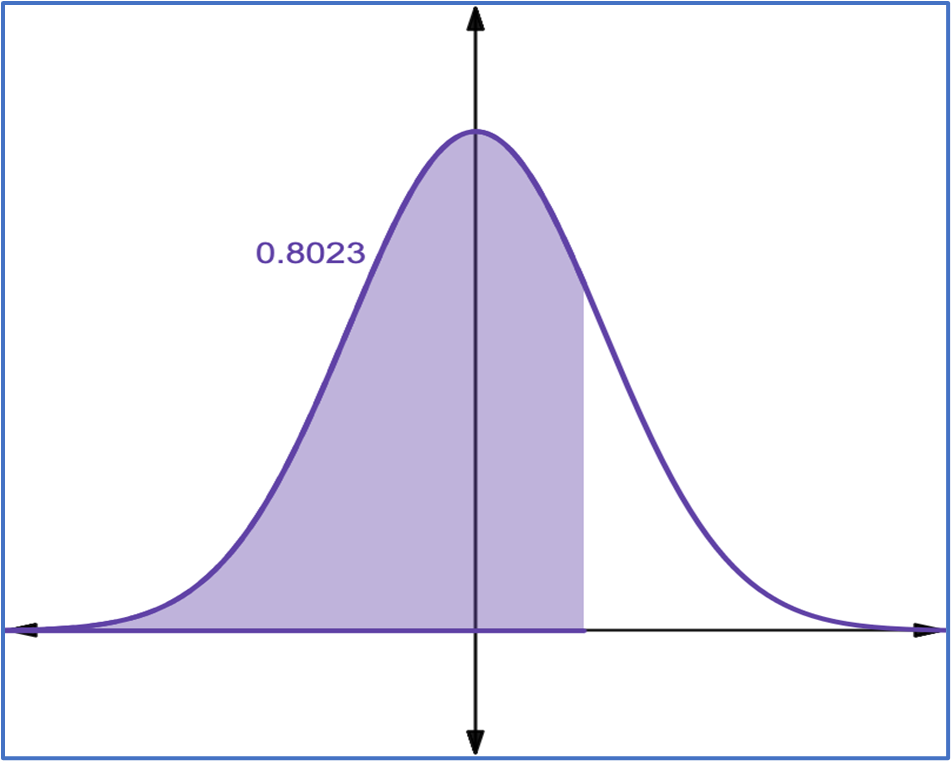
The graph depicts the standard normal distribution of test scores with a mean of
0
0
and a standard deviation of
1
1
. Find the indicated z-score.
A
−
0.75
-0.75
B
−
0.15
-0.15
C
0.15
0.15
D
0.85
0.85
AI tutor
0
0 Comments
Show Answer
More options