Statistics for Business
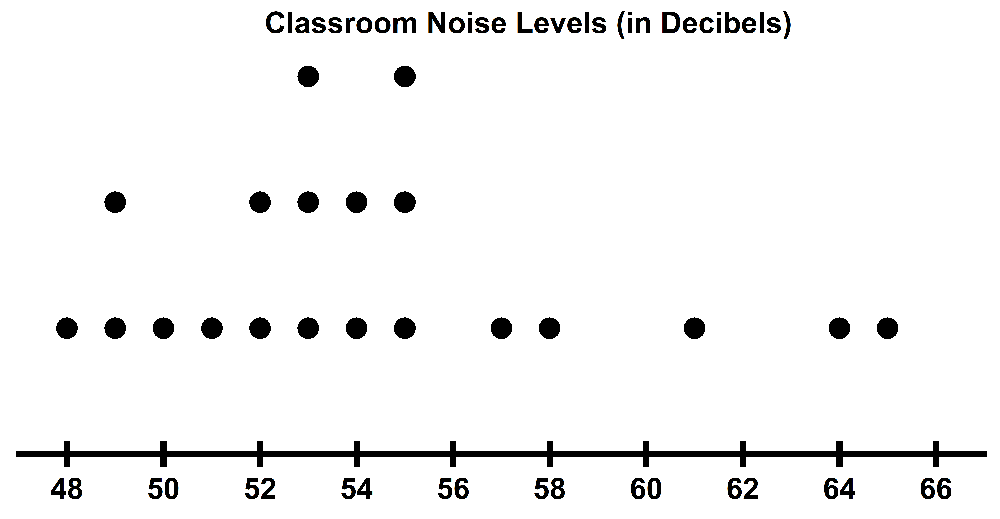
The noise levels are mostly clustered between 49 dB49~\(\text{dB}\) and 55 dB55~\(\text{dB}\), with a few higher values (6161, 6464, and 65 dB65~\(\text{dB}\)) that appear to be outliers.
The noise levels are mostly clustered between 61 dB61~\(\text{dB}\) and 65 dB65~\(\text{dB}\), with a few lower values (4848, 4949, and 50 dB50~\(\text{dB}\)) that appear to be outliers.