Skip to main content
Statistics for Business
My Course
Learn
Exam Prep
AI Tutor
Study Guides
Flashcards
Explore
Try the app
My Course
Learn
Exam Prep
AI Tutor
Study Guides
Flashcards
Explore
Try the app
Back
Mean
Download worksheet
Problem 1
Problem 2
Problem 3
Problem 4
Problem 5
Problem 6
Problem 7
Problem 8
Problem 9
Problem 10
Mean
Download worksheet
Practice
Summary
Previous
6 of 10
Next
3. Describing Data Numerically / Mean / Problem 6
Problem 6
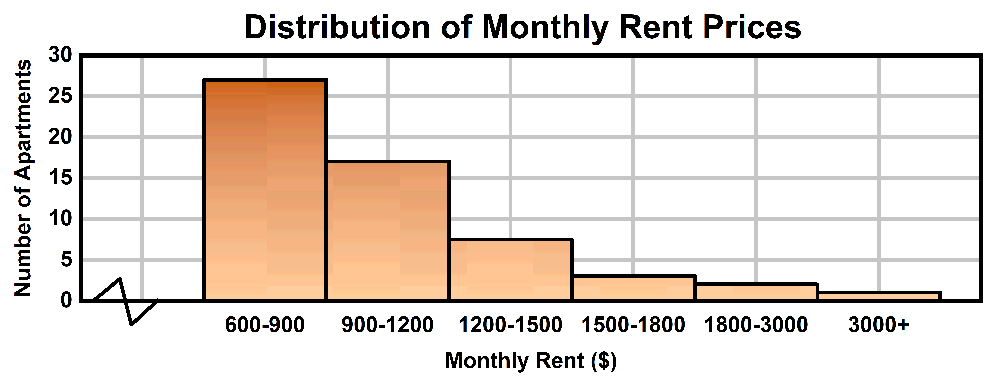
A bar graph shows the distribution of monthly rent prices in a city. Which measure of central tendency should be used to best represent the typical rent price?
A
Mean
B
Mode
C
Median
D
Standard deviation
AI tutor
0
0 Comments
Show Answer
More options