Skip to main content
Statistics for Business
My Course
Learn
Exam Prep
AI Tutor
Study Guides
Flashcards
Explore
Try the app
My Course
Learn
Exam Prep
AI Tutor
Study Guides
Flashcards
Explore
Try the app
Back
Mode
Download worksheet
Problem 1
Problem 2
Problem 3
Problem 4
Problem 5
Problem 6
Problem 7
Problem 8
Problem 9
Problem 10
Mode
Download worksheet
Practice
Summary
Previous
5 of 10
Next
3. Describing Data Numerically / Mode / Problem 5
Problem 5
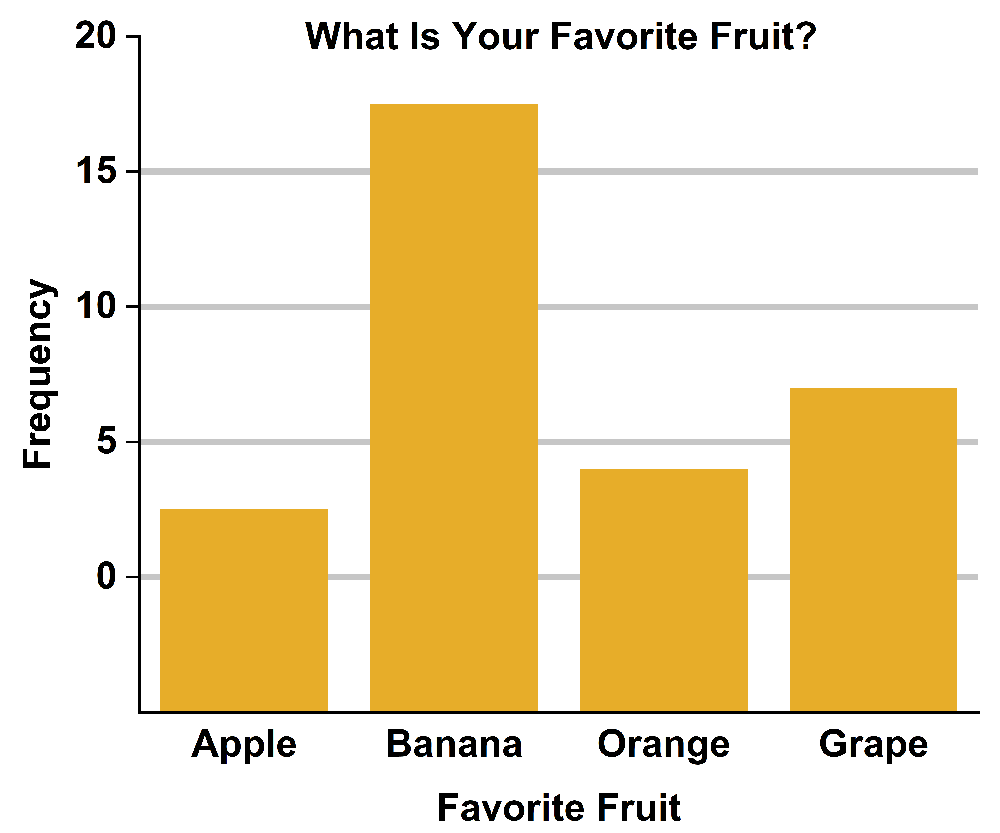
Based on the given graph, which measure of central tendency best represents the data?
A
Mean
B
Median
C
Mode
D
Cannot be determined
AI tutor
0
0 Comments
Show Answer
More options