6. Normal Distribution & Continuous Random Variables / Probabilities & Z-Scores w/ Graphing Calculator / Problem 5
Problem 5
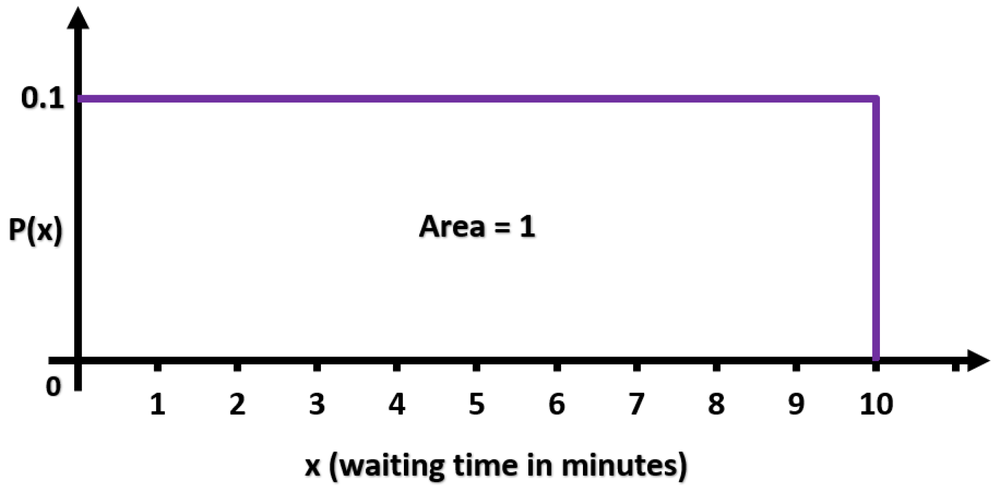
The figure below shows the continuous uniform distribution of customer waiting times at a coffee shop. Determine the mean and standard deviation for the distribution of the waiting times.