6. Normal Distribution & Continuous Random Variables / Standard Normal Distribution / Problem 1
Problem 1
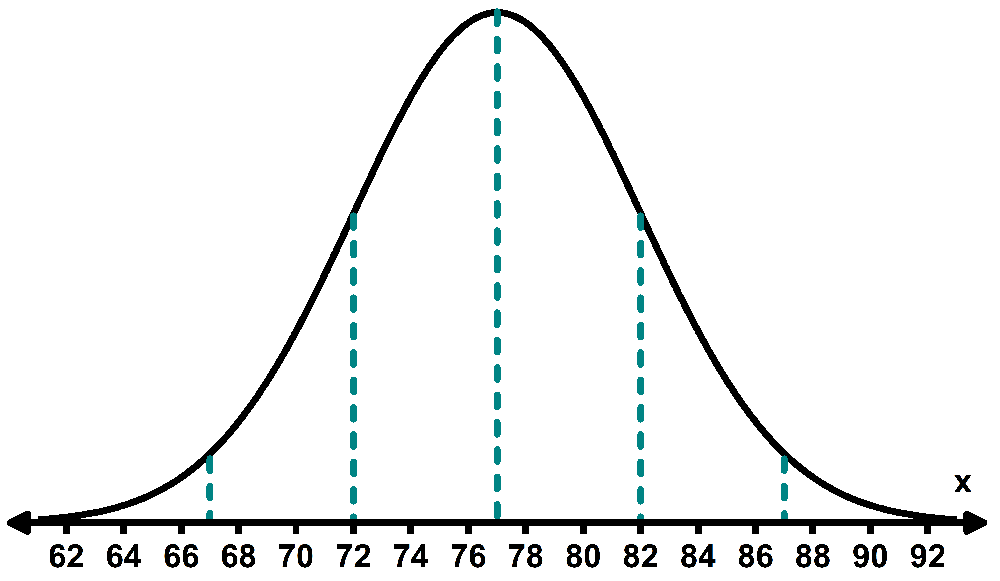
The dashed lines represent the mean and -standard-deviation intervals in the following normal distribution. Estimate the values of the mean and standard deviation.