Skip to main content
Statistics for Business
My Course
Learn
Exam Prep
AI Tutor
Study Guides
Flashcards
Explore
Try the app
My Course
Learn
Exam Prep
AI Tutor
Study Guides
Flashcards
Explore
Try the app
Back
Stemplots (Stem-and-Leaf Plots)
Download worksheet
Problem 1
Problem 2
Problem 3
Problem 4
Problem 5
Problem 6
Problem 7
Problem 8
Problem 9
Problem 10
Stemplots (Stem-and-Leaf Plots)
Download worksheet
Practice
Summary
Previous
10 of 10
2. Describing Data with Tables and Graphs / Stemplots (Stem-and-Leaf Plots) / Problem 10
Problem 10
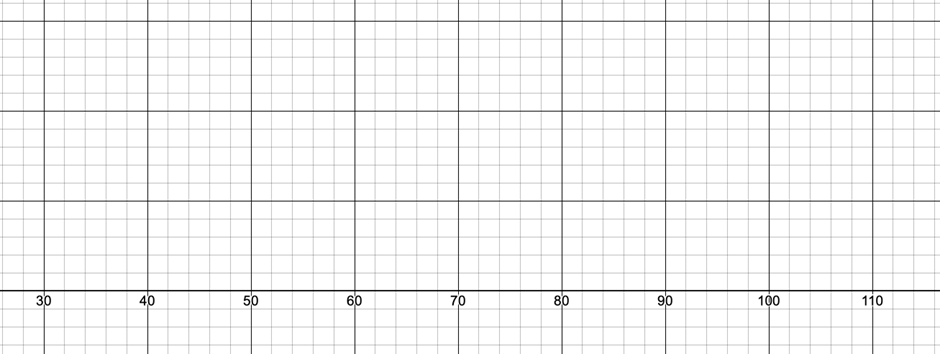
Use the following wait times (minutes) at 2:00 PM for the Space Mountain ride.
42 55 60 38 75 80 95 45 50 65 70 55
\(\text{42 55 60 38 75 80 95 45 50 65 70 55}\)
Construct a boxplot.
A
B
C
D
AI tutor
0
0 Comments
Show Answer
More options