Statistics for Business
If you have data for every quarter in a year, which is the best way to label the x-axis?
Which variable specification is needed to plot a time series, and which analytic use does the plot primarily serve?
If you are plotting monthly sales data, how should you label the axes of your time series graph?
Which of the following best describes a time series graph?
A hospital records the number of patients admitted each day for a week: 12, 15, 14, 16, 18, 17, 19. What trend is observed from day 1 to day 7?
A time series graph of quarterly profits shows a sharp decline in Q3 followed by a recovery in Q4. What might this pattern indicate?
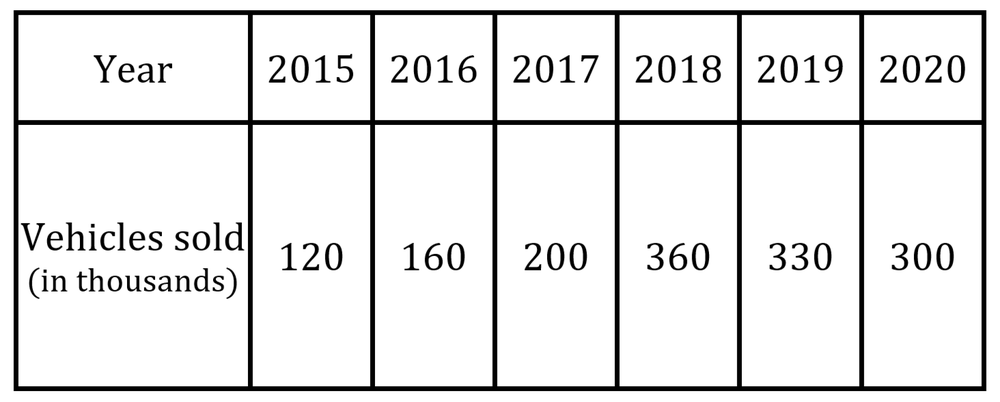
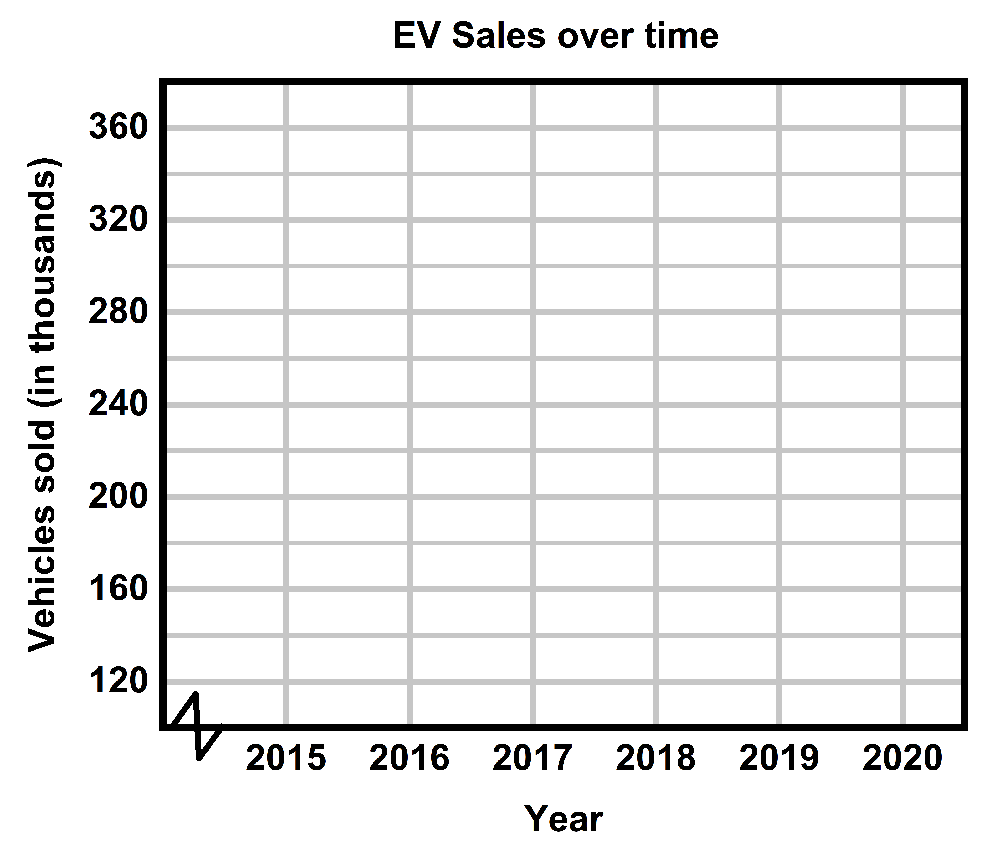
Use a time series chart to display the data shown in the table below. The data represents the number of electric vehicles (in units of thousands) sold from 20152015 to 20202020.
In a time series graph, what does the x-axis typically represent?
If you have monthly data for 24 months, which of the following is the most appropriate scale for the x-axis?
You have data for every other month in a year (Jan, Mar, May, Jul, Sep, Nov). What is the best way to label the x-axis?