Skip to main content
Statistics for Business
My Course
Learn
Exam Prep
AI Tutor
Study Guides
Flashcards
Explore
Try the app
My Course
Learn
Exam Prep
AI Tutor
Study Guides
Flashcards
Explore
Try the app
Back
Time-Series Graph
Download worksheet
Problem 1
Problem 2
Problem 3
Problem 4
Problem 5
Problem 6
Problem 7
Problem 8
Problem 9
Problem 10
Time-Series Graph
Download worksheet
Practice
Summary
Previous
7 of 10
Next
2. Describing Data with Tables and Graphs / Time-Series Graph / Problem 7
Problem 7
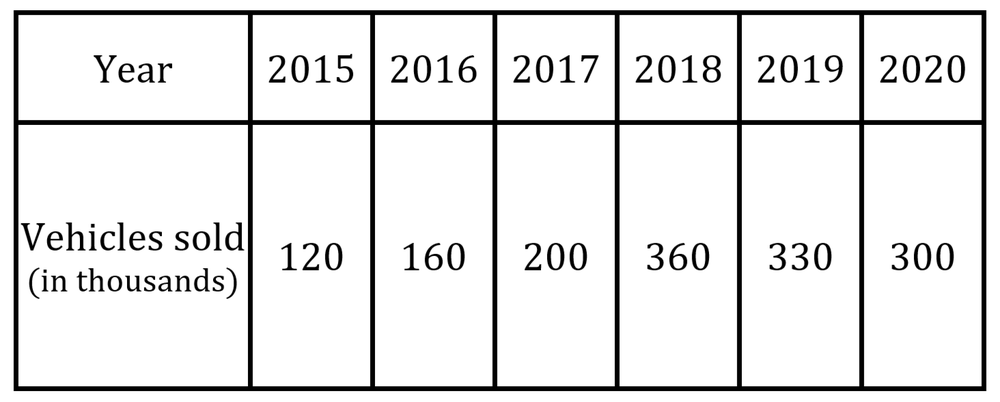
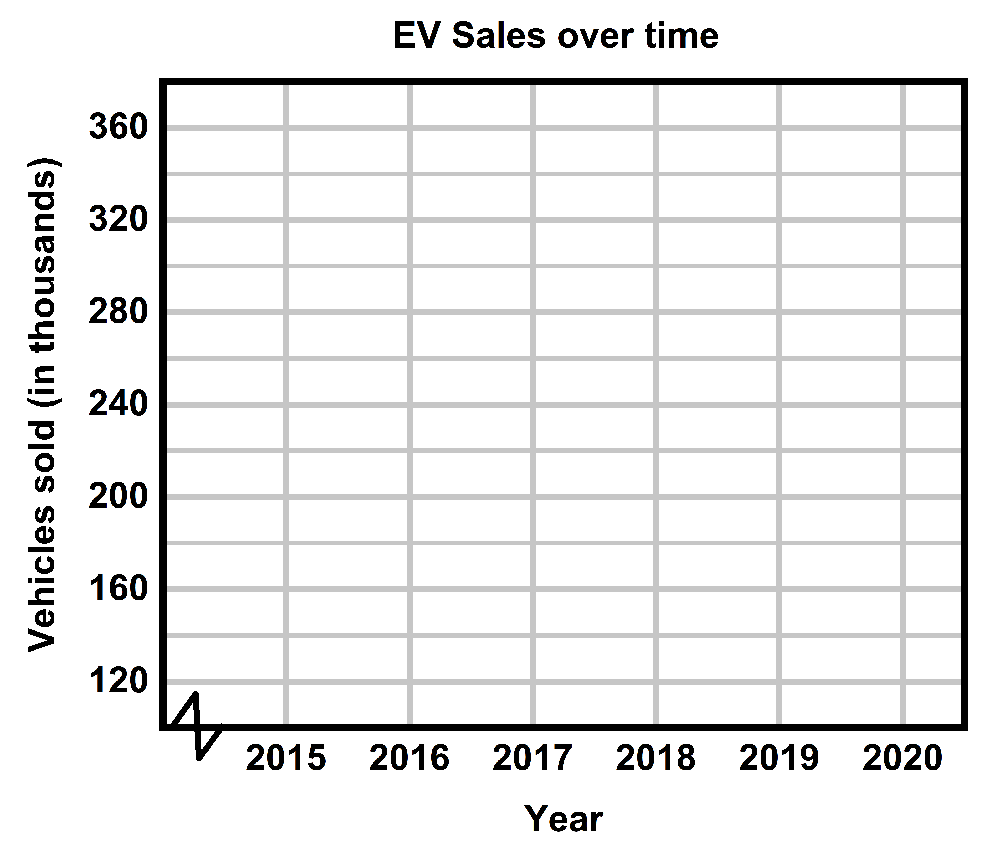
Use a time series chart to display the data shown in the table below. The data represents the number of electric vehicles (in units of thousands) sold from
2015
2015
to
2020
2020
.
A
B
C
D
AI tutor
0
0 Comments
Show Answer
More options