Skip to main content
Statistics for Business
My Course
Learn
Exam Prep
AI Tutor
Study Guides
Flashcards
Explore
Try the app
My Course
Learn
Exam Prep
AI Tutor
Study Guides
Flashcards
Explore
Try the app
Back
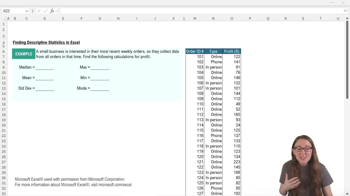
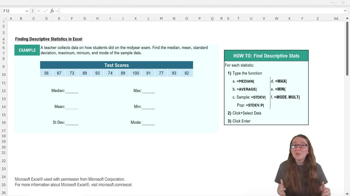
Descriptive Statistics-Excel definitions
You can tap to flip the card.
Descriptive Statistics
You can tap to flip the card.
👆
Descriptive Statistics
Summary measures that describe features of a dataset, such as central tendency, spread, and frequency of values.
Track progress
Control buttons has been changed to "navigation" mode.
1/15
Related flashcards
Related practice
Recommended videos
Descriptive Statistics-Excel quiz
Descriptive Statistics-Excel
15 Terms
3. Describing Data Numerically
8 topics
15 problems
Chapter
Jonathan
Guided course
06:10
Descriptive Statistics-Excel
189
views
2
rank
Guided course
05:30
Descriptive Statistics-Excel Example 1
121
views
5
rank
Terms in this set (15)
Hide definitions
Descriptive Statistics
Summary measures that describe features of a dataset, such as central tendency, spread, and frequency of values.
Median
The middle value in an ordered dataset, splitting the data into two equal halves.
Mean
The arithmetic average of a dataset, calculated by summing all values and dividing by the count.
Standard Deviation
A measure of how spread out values are around the mean, indicating variability in the dataset.
Maximum
The largest value present in a dataset, representing the upper bound of observed data.
Minimum
The smallest value present in a dataset, representing the lower bound of observed data.
Mode
The value or values that appear most frequently in a dataset; there can be more than one.
Sample Data
A subset of a population used to estimate characteristics of the whole group.
Population Data
All possible observations or measurements of interest for a particular group.
Central Tendency
A statistical concept referring to the center or typical value within a dataset.
Spread
The extent to which data values differ from each other, often measured by range or standard deviation.
Data Range
A selection of cells in Excel containing the values to be analyzed.
Formula Bar
The area in Excel where functions and calculations are entered and displayed.
Cell Reference
An identifier for a cell or group of cells in Excel, used to specify data locations in formulas.
Statistical Process Control
A method of monitoring and controlling processes using statistical measures to ensure quality.
 BackBack
 06:10
06:10