Skip to main content
Statistics for Business
My Course
Learn
Exam Prep
AI Tutor
Study Guides
Flashcards
Explore
Try the app
My Course
Learn
Exam Prep
AI Tutor
Study Guides
Flashcards
Explore
Try the app
Back
Finding Residuals and Creating Residual Plots - Excel definitions
You can tap to flip the card.
Residual
You can tap to flip the card.
👆
Residual
The difference between an observed value and its corresponding predicted value from a regression equation.
Track progress
Control buttons has been changed to "navigation" mode.
1/14
Related flashcards
Related practice
Recommended videos
Finding Residuals and Creating Residual Plots - Excel quiz
Finding Residuals and Creating Residual Plots - Excel
15 Terms
12. Regression
4 topics
15 problems
Chapter
Ally
Guided course
06:42
Finding Residuals and Creating Residual Plots - Excel Example 1
87
views
Guided course
04:26
Finding Residuals and Creating Residual Plots - Excel
122
views
Terms in this set (14)
Hide definitions
Residual
The difference between an observed value and its corresponding predicted value from a regression equation.
Residual Plot
A scatterplot displaying differences between actual and predicted values against the explanatory variable to assess model fit.
Regression Line
A straight line summarizing the relationship between two variables, used to predict values of the dependent variable.
Predicted Value
An estimated outcome calculated by substituting an explanatory variable into a regression equation.
Scatter Plot
A chart that visually represents the relationship between two quantitative variables using plotted points.
Explanatory Variable
An independent variable used to explain or predict changes in another variable within a dataset.
Dependent Variable
A measured outcome whose variation is explained or predicted by another variable in regression analysis.
Trend Line
A visual line added to a scatter plot to indicate the general direction or pattern of the data.
Linear Model
A mathematical representation assuming a straight-line relationship between two variables.
Equation of Regression Line
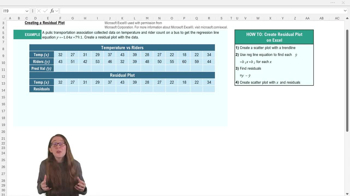
A formula, such as y = −1.04x + 79.1, used to compute predicted values based on the explanatory variable.
Random Scatter
A pattern in a residual plot where points are distributed without systematic structure, indicating a good model fit.
Model Fit
An assessment of how well a statistical model represents the observed data, often evaluated using residuals.
Chart Title
A label added to a graph or plot to clarify its content and distinguish between different visualizations.
Practice Examples
Sample exercises provided to reinforce understanding and application of statistical concepts in Excel.
 BackBack
 06:42
06:42