Skip to main content
Statistics for Business
My Course
Learn
Exam Prep
AI Tutor
Study Guides
Flashcards
Explore
Try the app
My Course
Learn
Exam Prep
AI Tutor
Study Guides
Flashcards
Explore
Try the app
Back
Finding Residuals and Creating Residual Plots - Excel quiz
You can tap to flip the card.
What is the formula for calculating a residual in regression analysis?
You can tap to flip the card.
👆
What is the formula for calculating a residual in regression analysis?
A residual is calculated as the actual y value minus the predicted y value (y - ŷ).
Track progress
Control buttons has been changed to "navigation" mode.
1/15
Related flashcards
Related practice
Recommended videos
Finding Residuals and Creating Residual Plots - Excel definitions
Finding Residuals and Creating Residual Plots - Excel
14 Terms
12. Regression
4 topics
15 problems
Chapter
Ally
Guided course
06:42
Finding Residuals and Creating Residual Plots - Excel Example 1
87
views
Guided course
04:26
Finding Residuals and Creating Residual Plots - Excel
122
views
Terms in this set (15)
Hide definitions
What is the formula for calculating a residual in regression analysis?
A residual is calculated as the actual y value minus the predicted y value (y - ŷ).
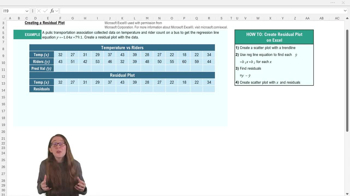
What is the regression line equation used in the example for predicting rider count?
The regression line equation is y = -1.04x + 79.1.
What is the first step in creating a residual plot in Excel?
The first step is to create a scatter plot of the original data.
How do you display the regression line equation on a scatter plot in Excel?
You add a trend line, then check 'Display equation on chart' in the trend line options.
How do you calculate predicted y values (ŷ) in Excel using the regression equation?
Plug each x value into the regression equation to compute the corresponding predicted y (ŷ).
What Excel feature allows you to quickly copy a formula to multiple cells?
You can use the solid black cross at the cell's corner to click and drag the formula across cells.
What data do you need to create a residual plot in Excel?
You need the explanatory variable (x) and the calculated residuals.
What does a residual plot with randomly scattered points near zero indicate?
It indicates a good fit for the linear model and validates regression assumptions.
Why is it important to create a scatter plot before a residual plot?
A scatter plot visually shows the relationship between variables and helps assess if a linear model is appropriate.
How do you calculate all residuals in Excel after finding predicted values?
Subtract each predicted y (ŷ) from the actual y and copy the formula across all data points.
What should the title of your residual plot in Excel be?
The title should be 'Residual Plot' to distinguish it from the original scatter plot.
Where is it helpful to place the residual plot relative to the original scatter plot?
Place the residual plot below the original scatter plot to compare both visually.
What does it mean if residuals are both positive and negative and close to zero?
It suggests the linear model fits the data well, with no systematic error.
What is the purpose of a residual plot in regression analysis?
A residual plot helps validate the fit of the regression model and check for randomness in errors.
What should you do if you want more practice creating residual plots in Excel?
You should check out additional examples and practice exercises provided in the lesson.
 BackBack
 06:42
06:42