Skip to main content
Statistics for Business
My Course
Learn
Exam Prep
AI Tutor
Study Guides
Flashcards
Explore
Try the app
My Course
Learn
Exam Prep
AI Tutor
Study Guides
Flashcards
Explore
Try the app
Back
Goodness of FIt Test Using TI-84 definitions
You can tap to flip the card.
Goodness of Fit Test
You can tap to flip the card.
👆
Goodness of Fit Test
Statistical procedure for assessing how well observed frequencies align with a claimed distribution across categories.
Track progress
Control buttons has been changed to "navigation" mode.
1/15
Related flashcards
Related practice
Recommended videos
Goodness of FIt Test Using TI-84 quiz
Goodness of FIt Test Using TI-84
15 Terms
13. Chi-Square Tests & Goodness of Fit
3 topics
15 problems
Chapter
Brendan
Guided course
04:49
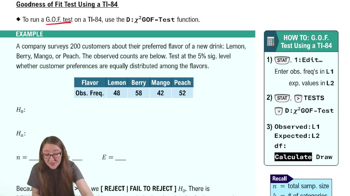
Goodness of Fit Test Using a TI-84
91
views
Guided course
03:25
Goodness of Fit Test Using a TI-84 Example 3
62
views
Guided course
03:46
Goodness of Fit Test Using a TI-84 Example 1
61
views
Terms in this set (15)
Hide definitions
Goodness of Fit Test
Statistical procedure for assessing how well observed frequencies align with a claimed distribution across categories.
Observed Frequency
Actual count of occurrences recorded in each category during data collection.
Expected Value
Calculated count for each category assuming the claim distribution is true, often using total sample size and number of categories.
Claim Distribution
Proposed or hypothesized allocation of frequencies across categories used as a basis for comparison.
Null Hypothesis
Assumption that observed frequencies match the claim distribution, serving as the default position in the test.
Alternative Hypothesis
Statement suggesting observed frequencies differ from the claim distribution, challenging the null hypothesis.
Degrees of Freedom
Value found by subtracting one from the number of categories, used in determining the test's reference distribution.
Significance Level
Threshold probability, often set at 0.05, used to decide whether to reject the null hypothesis.
P-value
Probability of observing data as extreme as, or more extreme than, the sample results under the null hypothesis.
Chi-Square Statistic
Numerical measure quantifying the discrepancy between observed and expected frequencies across categories.
Contribution Value
Individual category's impact on the overall chi-square statistic, indicating how much each observed count deviates from expectation.
TI-84 Calculator
Graphing device featuring statistical functions, including the chi-square goodness of fit test for analyzing categorical data.
Test Menu
Section within the calculator interface where statistical tests, such as the chi-square GOF test, are selected.
Alpha
Symbol representing the significance level, used as a cutoff for determining statistical evidence against the null hypothesis.
Category
Distinct group or classification within the data, such as different flavors in a preference survey.
 BackBack
 04:49
04:49