Skip to main content
Statistics for Business
My Course
Learn
Exam Prep
AI Tutor
Study Guides
Flashcards
Explore
Try the app
My Course
Learn
Exam Prep
AI Tutor
Study Guides
Flashcards
Explore
Try the app
Back
Prediction Intervals - Excel definitions
You can tap to flip the card.
Prediction Interval
You can tap to flip the card.
👆
Prediction Interval
A range around a predicted value that accounts for uncertainty, providing likely upper and lower bounds for a single future observation.
Track progress
Control buttons has been changed to "navigation" mode.
1/15
Related flashcards
Related practice
Recommended videos
Prediction Intervals - Excel quiz
Prediction Intervals - Excel
15 Terms
12. Regression
4 topics
15 problems
Chapter
Ally
Guided course
08:20
Prediction Intervals - Excel
64
views
Terms in this set (15)
Hide definitions
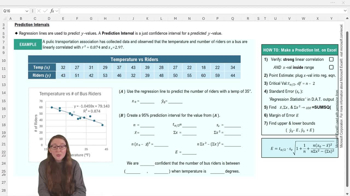
Prediction Interval
A range around a predicted value that accounts for uncertainty, providing likely upper and lower bounds for a single future observation.
Regression Line
A straight line that best fits the data points in a scatterplot, used to estimate the relationship between variables.
Margin of Error
The amount added and subtracted from a point estimate to create an interval, reflecting prediction uncertainty.
Critical Value
A t-distribution value that determines the width of the interval, based on confidence level and sample size.
Standard Error
A measure of the typical distance between observed values and the regression line, indicating prediction accuracy.
Linear Correlation
A statistical relationship where changes in one variable are associated with proportional changes in another.
R Squared
A statistic showing the proportion of variation in the dependent variable explained by the regression model.
Degrees of Freedom
The number of independent values in a calculation, often equal to sample size minus two in regression.
Point Estimate
A single predicted value for the dependent variable, calculated using the regression equation.
Mean of X
The average value of all predictor variable observations in the dataset.
Sum of Squares
The total of each predictor value squared, used in calculating variance and interval width.
Confidence Interval
A range estimating where a population parameter lies, similar to but narrower than a prediction interval.
Scatterplot
A graph displaying paired data points, revealing patterns and the strength of relationships.
Data Range
The span between the smallest and largest observed values for the predictor variable.
Excel Function
A built-in tool in Excel, such as AVERAGE or SUMSQ, used to automate statistical calculations.
 BackBack
 08:20
08:20