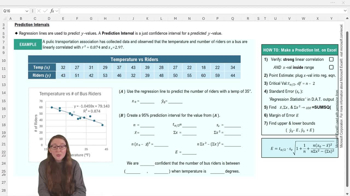
What is a prediction interval in the context of regression analysis?
A prediction interval provides a range of values within which a predicted y value is expected to fall, accounting for uncertainty in the prediction.
What two conditions must be met before creating a prediction interval?
There must be a strong linear correlation between the variables, and the predictor x value must be within the range of the observed data.
How do you calculate the predicted y value (ŷ) for a given x in regression?
Plug the x value into the regression line equation to compute the predicted y value.
What Excel function is used to find the critical t-value for a prediction interval?
Use the T.INV.2T function in Excel, with alpha and degrees of freedom as inputs.
How do you determine the degrees of freedom for the t critical value in linear regression?
Degrees of freedom are calculated as n - 2, where n is the number of data pairs.
What is the formula for the margin of error (e) in a prediction interval?
e = tα/2 × se × sqrt(1 + 1/n + (x₀ - x̄)² / (Σx² - (Σx)²/n)).
Which Excel function calculates the mean of x values?
The AVERAGE function is used to calculate the mean of x values.
How do you find the sum of x values in Excel?
Use the SUM function and select the x data range.
Which Excel function is used to calculate the sum of squares of x values?
The SUMSQ function calculates the sum of the squares of x values.
What does a high R² value indicate about the regression model?
A high R² value indicates a strong linear correlation between the variables.
How do you calculate the lower bound of a prediction interval?
Subtract the margin of error (e) from the point estimate (ŷ) to get the lower bound.
How do you calculate the upper bound of a prediction interval?
Add the margin of error (e) to the point estimate (ŷ) to get the upper bound.
Why must the x value for prediction be within the data range?
Predictions for x values outside the data range may not be reliable because the model is not validated for those values.
What is the standard error (se) in regression, and how can you obtain it in Excel?
The standard error measures the typical distance between observed and predicted y values and can be found in the regression output from Excel's Data Analysis Toolpak.
What does a 95% prediction interval mean in practical terms?
It means we are 95% confident that the actual y value for a given x will fall within the calculated interval.
 Back
Back
 08:20
08:20